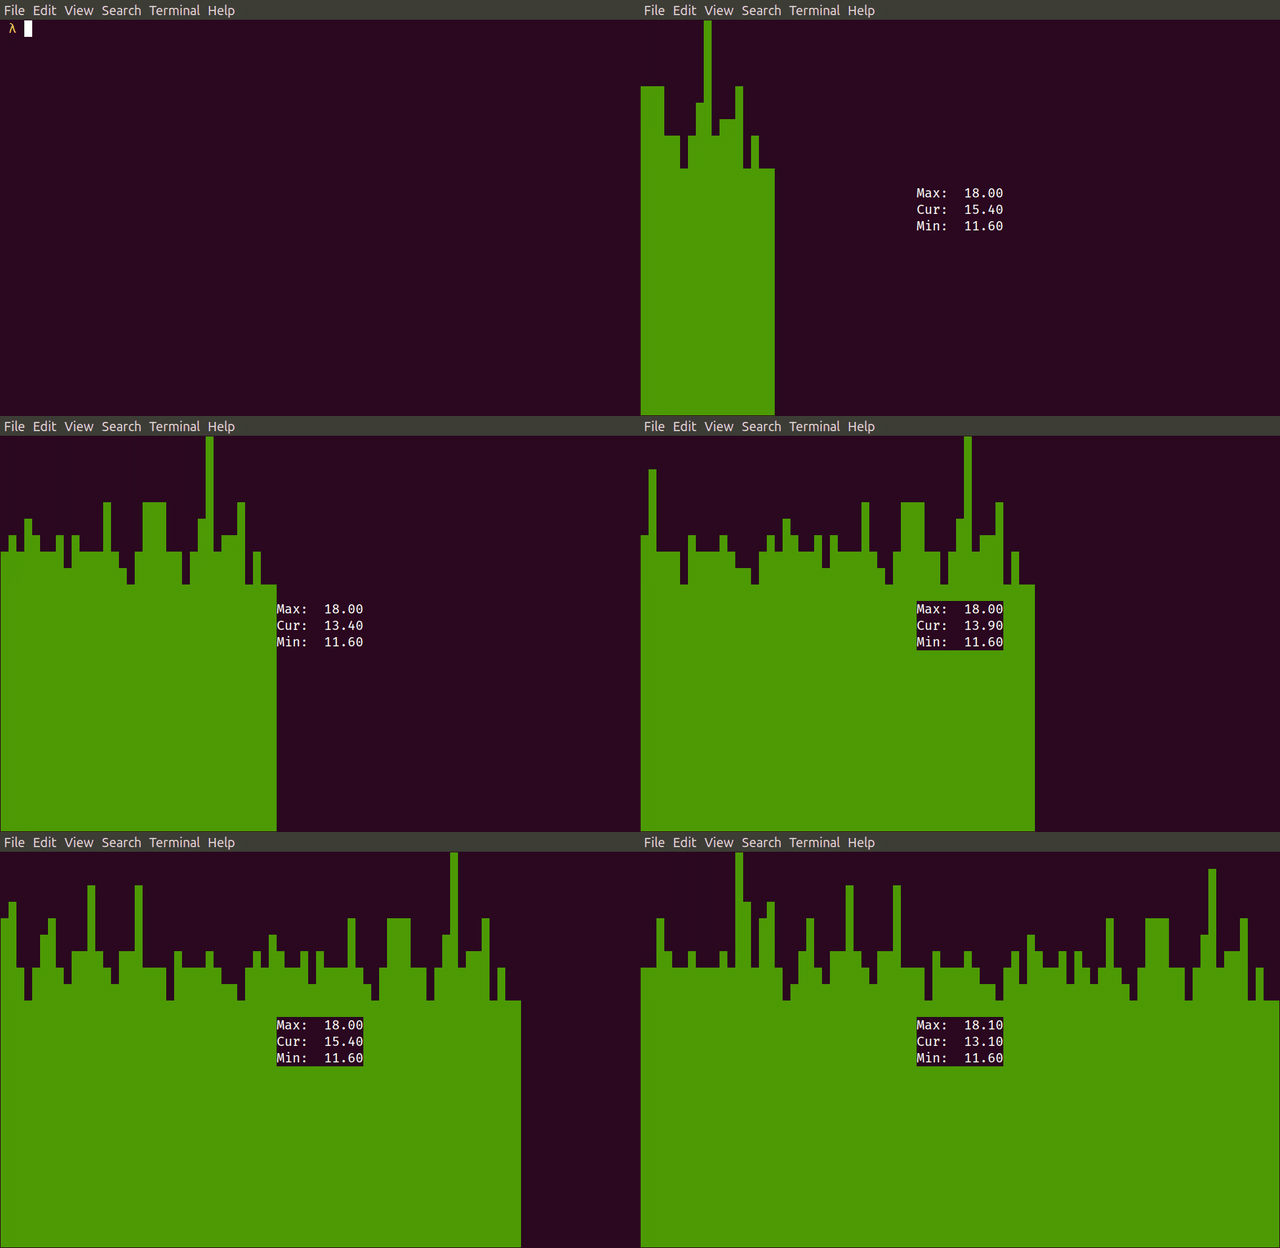


pipeplot draws an interactive graph in a terminal based on data from pipe.
pip install pipeplotping ya.ru | grep --line-buffered time | sed -u -e 's#.*time=\([^ ]*\).*#\1#' | pipeplot --min 0while true; \
do curl -s https://coronavirus-19-api.herokuapp.com/all \
| jq '.deaths'; \
sleep 60; \
done \
| pipeplot --color 1 --direction leftAPI: https://github.com/javieraviles/covidAPI
while true; \
do \
    curl -s 'http://graphite/render?target=my_app_rps_error&format=json&from=-5min&until=now' \
    | jq -c '.[0].datapoints[-1]'; \
    sleep 5; \
done \
| sed -u s/null/0/ \
| stdbuf -oL uniq \
| stdbuf -oL jq '.[0]' \
| pipeplot