
Maud -> Kinetic Modeling Software \ Stan -> Bayesian Inference Package
The methionine cycle is a fundamental pathway in human metabolism. Its intermediates participate in a variety of mechanisms competing for the same resources. These functions all occur simultaneously resulting in a highly regulated pathway with approximately 6 allosteric effectors. In order to understand the operation of the methionine cycle we constructed a kinetic model as a system of ODEs, where the state variables are the metabolite concentrations and the fluxes are constrained by mechanistic rate laws. However, these systems are described as ‘sloppy parameter’ systems, where the marginal parameter distributions can be large, yet still display tight posterior predictions. Furthermore, measuring these parameters independently is obscured by measuring the system in in vitro conditions, as opposed to those experienced in vivo. This prevents the standard practice of placing tight priors on the parameter values.

The previous sampling run did not converge between chains, upon rerunning the simulation with a longer warmup and samling phase we were able to achieve all Rhat values < 1.01. The rerun of simulations was conducted with simulated data constraining all metabolites and assuming 10% noise. The number of simulated experiments is 2 and the new data is under data/maud_output-methionine_cycle
Comparing the posterior distribution to the prior, it's easy to see a strong contraction towards the measured values. The prior concentrations
and fluxes vary on the order of magnitude level, whilst this is less prevalent in the posterior.

The dramatic increase in posterior performance for the measured variables is less noticeable in the parameters and is typical of sloppy parameter systems1. Most posteriors span similar orders of magnitude as their prior, especially with the Michaelis-Menten constants (kms). This isn't the case with equilibrium constants (keqs), whose values, in combination with metabolite concentrations determine the directionality of fluxes.
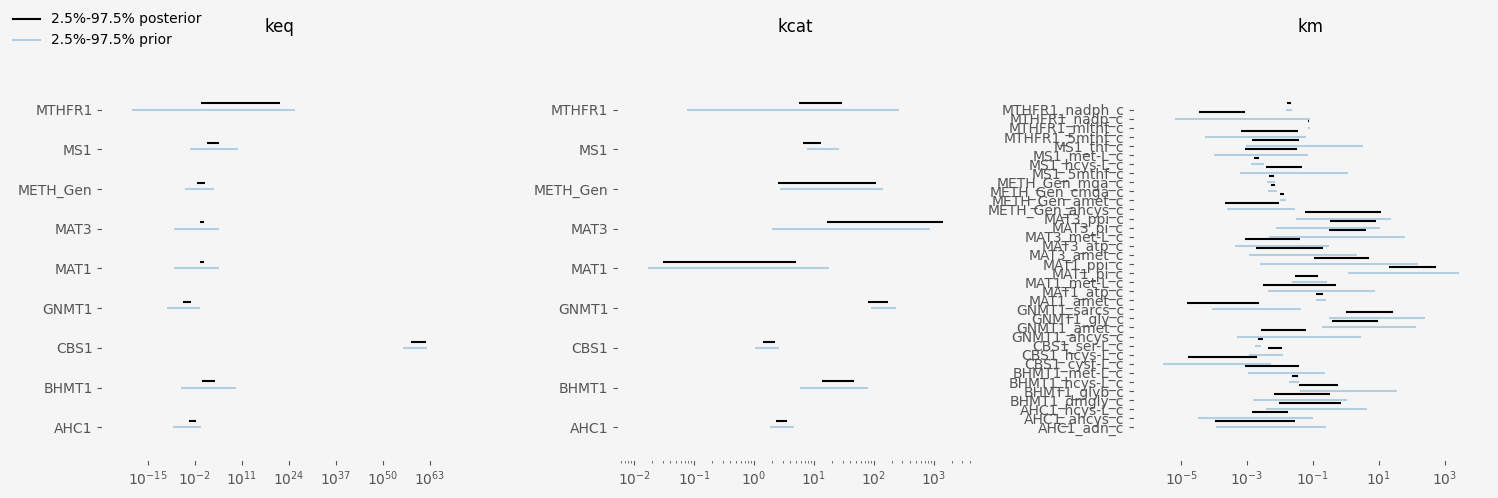
In order to understand how the sloppy parameter system arrises we can observe the pair plots, specifically for the enzyme CBS1. This enzyme has a highly correlation between the kcat parameter and the Michaelis-Menten (Km) constant for hcyc-L. A possible explanation of this is rate law is multiplicatively degenerate with kcat/Km = constant. This typically is not the case as the Km also influences enzyme saturation and may explain why the Km for ser-L is not highly correlated.

Another interesting observation is the skewed equilibrium constants within MS1 and AHC1. There also appears to be interesting interactions between the Kms as well as Keqs within these enzymes as well. This interaction likely arises from the Haldane relationship where the reverse catalytic rate for reversible reactions is constrained by the Keq and Kms. This could result in higher dimensional correlations that are unidentifiable in pair plots. To remove these correlations more experiments must be conducted that constrain the Km parameters. By constraining these parameters further the correlations in the posterior space will dissipate, and potentially improve sampling speed.


Despite the degenerate posterior distribution of kinetic parameters, particularly with Kms and Keqs, the concentrations and fluxes are able to be fit. This is characteristic of the systems studied by Gutenkunst et al., who found that this problem persists even with increasing amounts of data. An improvement that can immediately be made would be to sample the Keq by using a multivariate distribution of the formation energies, this will constrict the prior as the confidence interval on the reaction level is typically smaller than that displayed by sampling marginal distributions of the metabolites. It would be interesting to see how this impacts the current distribution shown in the AHC1 and MS1 pair plots as the prior information on the Keq should impact the strange geometry observed.
Much like the findings of how sloppy parameter systems, we were able to accurately characterise the fluxes and concentrations without significantly improving our understanding of the parameters. These findings cast doubt on how current parameter uncertainties are presented, primarily by their marginal distributions. Particularly, the relationships between Keqs and Kms which appear to present more than just a correlated behaviour but somewhat of a hyperbolic relationship.
Further development of such model will require validation datasets to estimate the generality of the sampled parameters. Future research will explore if the sparse and correlated kinetic parameters result in tighter macroscopic descriptors, such as: is this enzyme primarily regulated by thermodynamics or the saturation of the enzyme.
- Gutenkunst, R. N. et al. Universally sloppy parameter sensitivities in systems biology models. PLoS Computational Biology 3, 1871–1878 (2007).
- Stan Development Team. 2021. Stan Modeling Language Users Guide and Reference Manual, 2.26.0. https://mc-stan.org