Cannot reproduce plot in ipynb with counts=True #6
Comments
|
I can reproduce this issue. The option 'counts' simply selects different ways to store the graph internally (in graph-tool). Whe reason why we end up with different results is that graph-tool's algorithm is stochastic and can end up in different local minima (of the description length) if starting from different initial conditions. While I set a seed for graph-tool's random number generator, I assume that the different representations of the graph lead to different selection of random numbers. Therefore we end up with different solutions. In this dataset, there are in fact two solutions with similarly small description length (corresponding roughly to the two cases you describe above). The seemingly 'unordered' solution is thus not necessarily an artifact. With slightly larger datasets, I assume that it will be less liklely to end up in such a local minimum. |
|
Sorry, that wasn't right. I've managed to set weighted_edges=False for all and hence have duplicates. Will get back to you! |
|
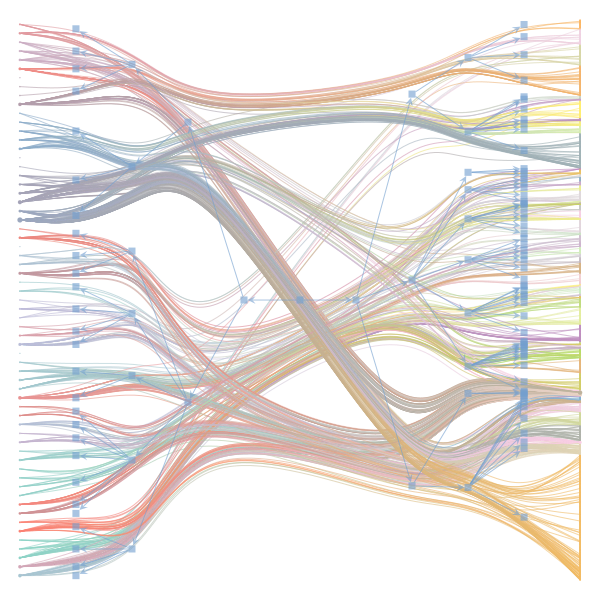
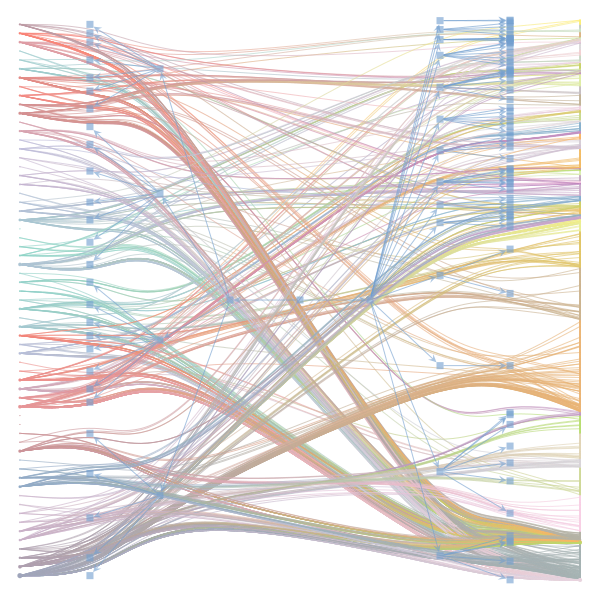
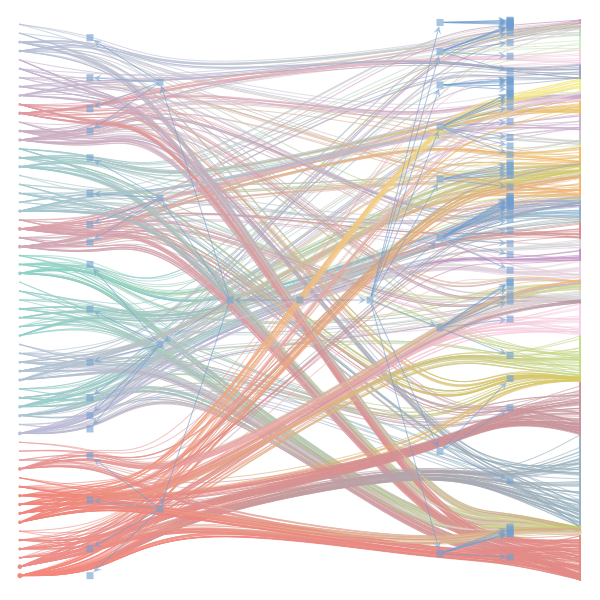
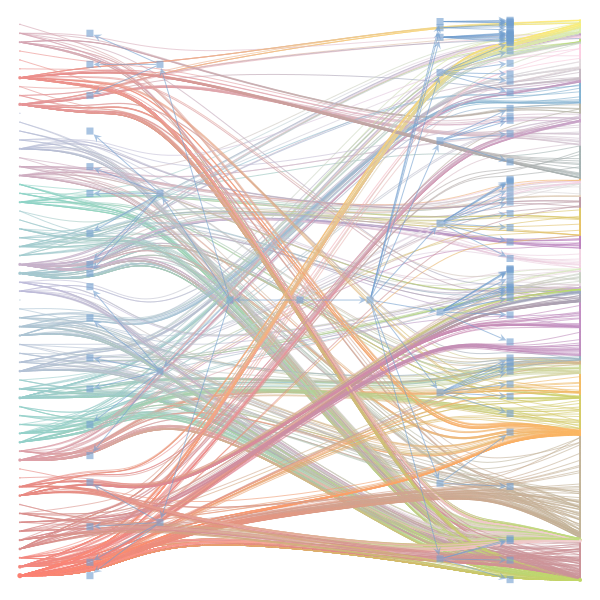
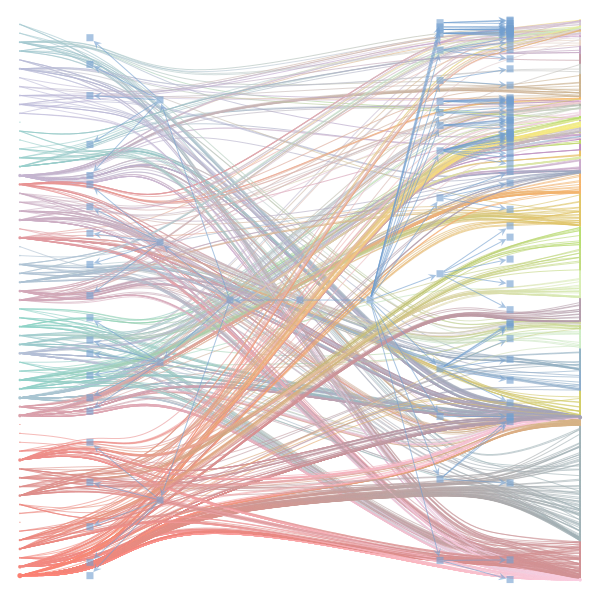
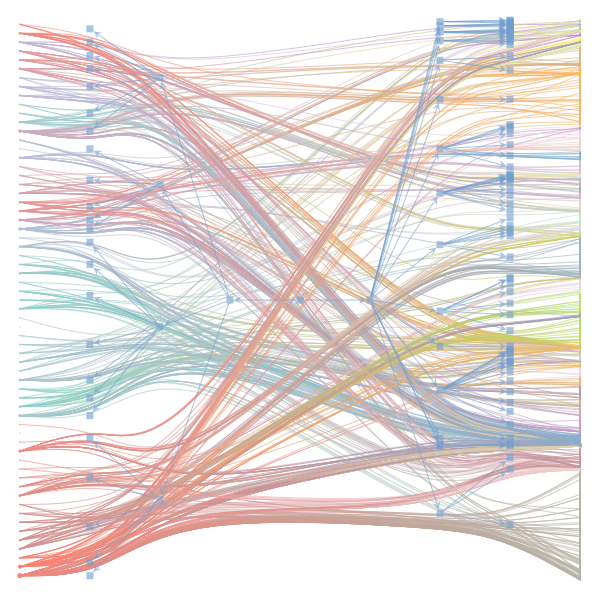
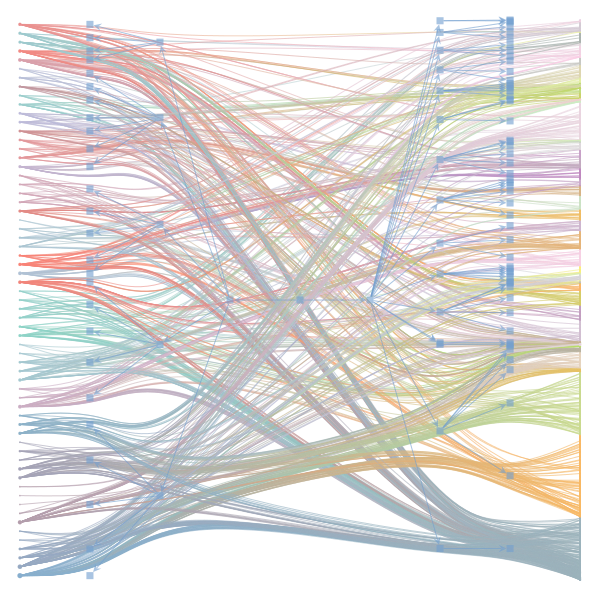
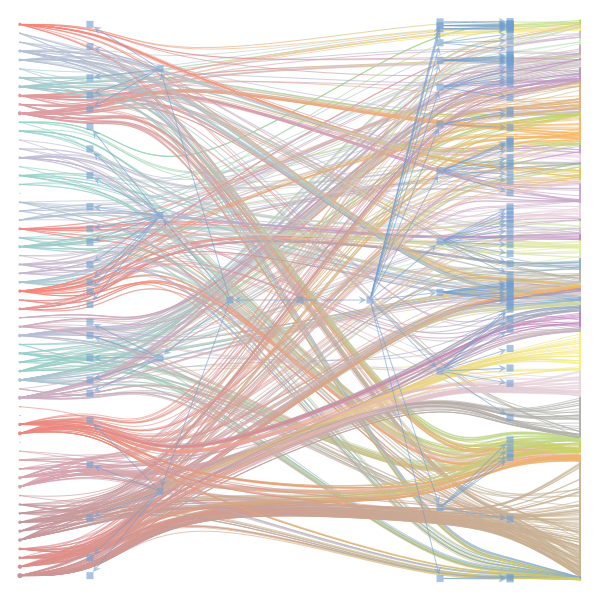
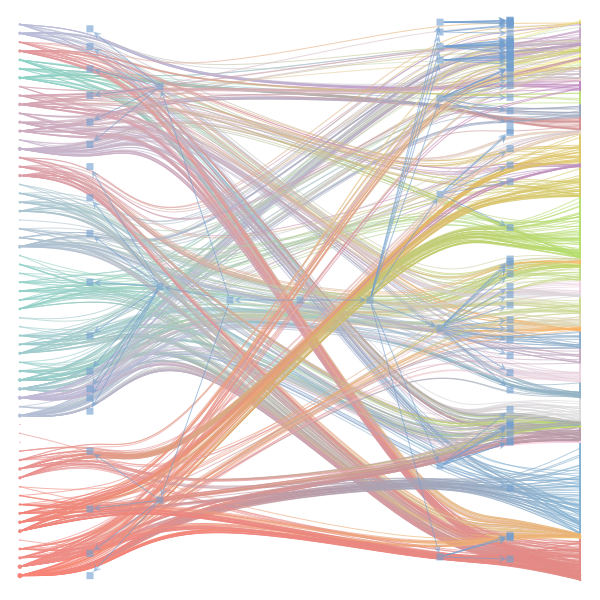
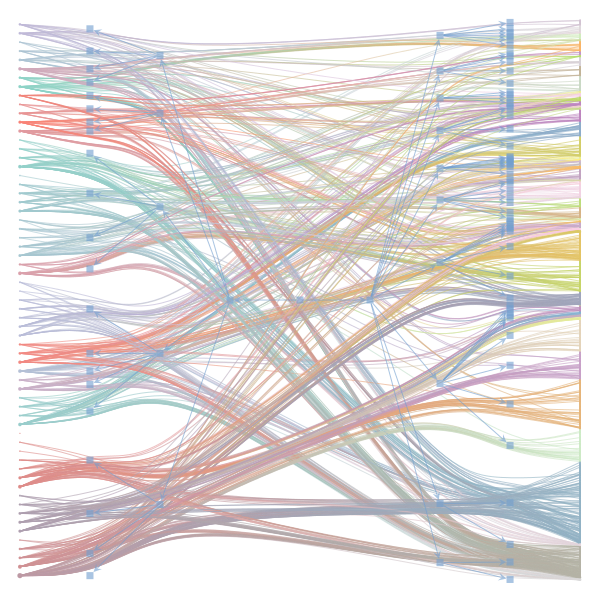
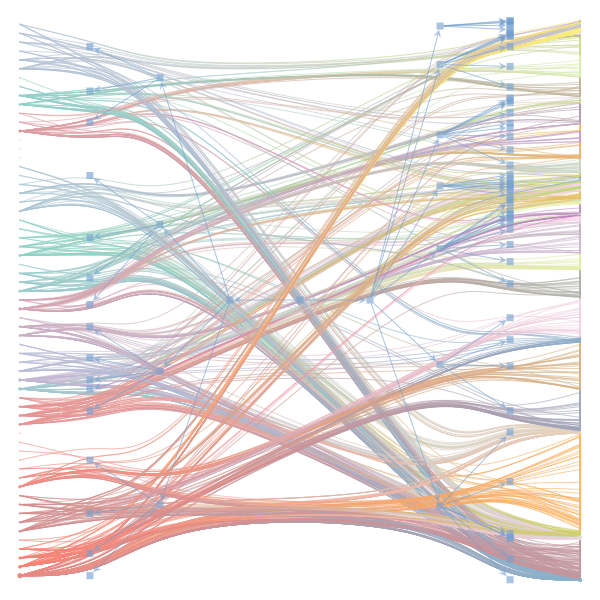
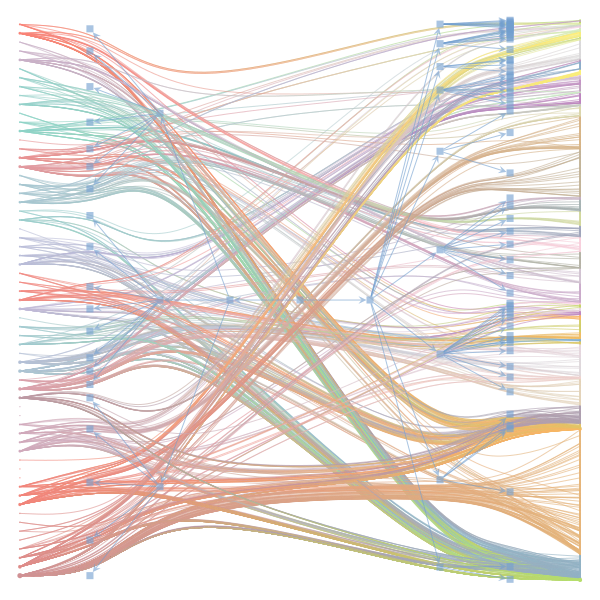
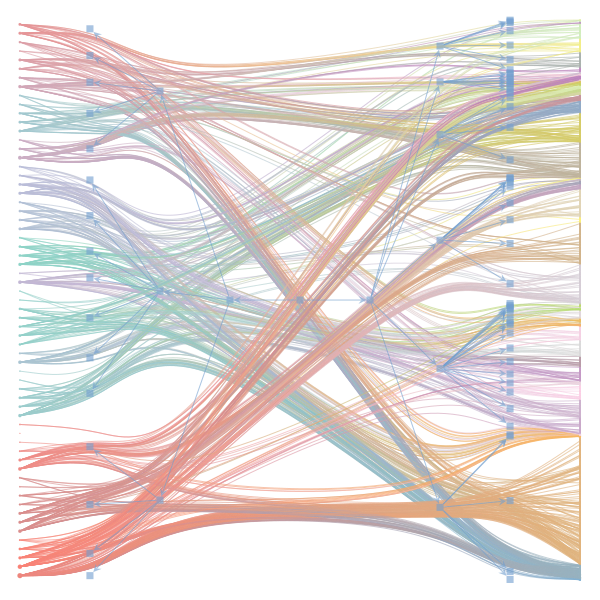
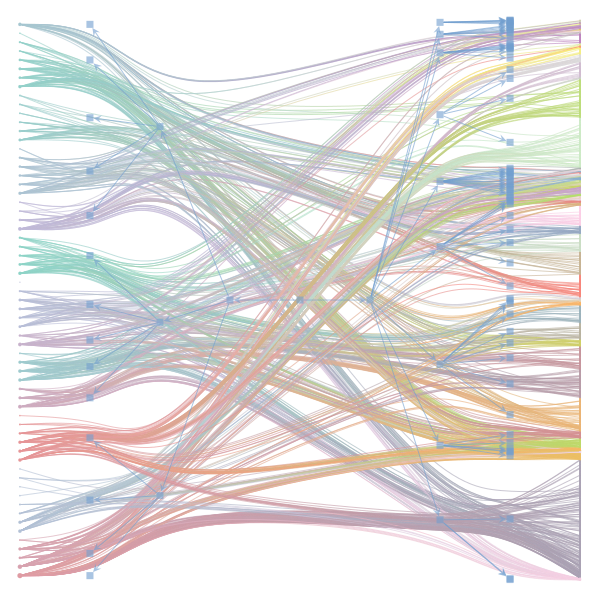
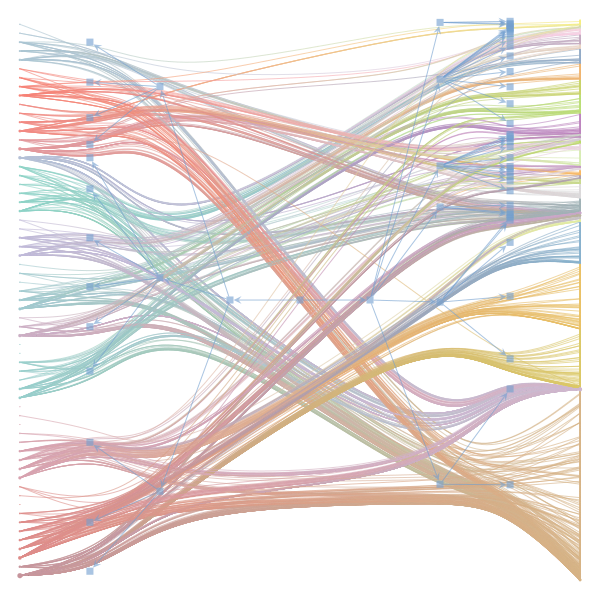
What makes a good plot? In order of increasing MDL: mdl_=58957.20, weighted_edges=False, random_state=05 mdl_=59300.43, weighted_edges=False, random_state=07 mdl_=59371.08, weighted_edges=True, random_state=01 mdl_=59380.66, weighted_edges=False, random_state=02 mdl_=59400.69, weighted_edges=False, random_state=06 mdl_=59509.75, weighted_edges=False, random_state=04 mdl_=59545.63, weighted_edges=True, random_state=07 mdl_=59592.45, weighted_edges=True, random_state=00 mdl_=59627.54, weighted_edges=True, random_state=09 mdl_=59661.09, weighted_edges=True, random_state=08 mdl_=59695.71, weighted_edges=False, random_state=00 mdl_=59779.18, weighted_edges=False, random_state=09 mdl_=59891.56, weighted_edges=True, random_state=06 mdl_=60080.87, weighted_edges=True, random_state=04 mdl_=60555.99, weighted_edges=False, random_state=03 mdl_=61911.79, weighted_edges=False, random_state=01 mdl_=62661.11, weighted_edges=True, random_state=03 mdl_=62839.40, weighted_edges=False, random_state=08 mdl_=63401.70, weighted_edges=True, random_state=02 mdl_=63412.52, weighted_edges=True, random_state=05 |
|
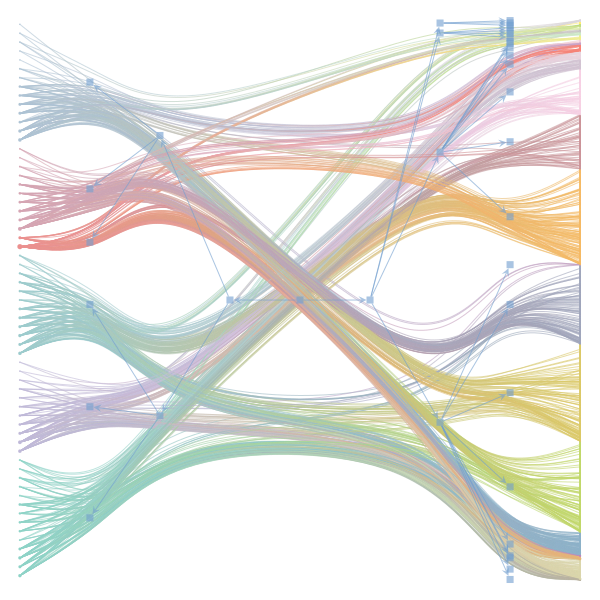
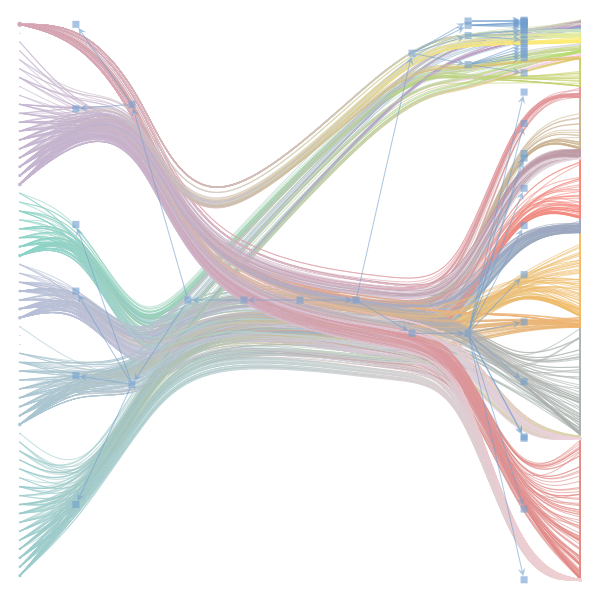
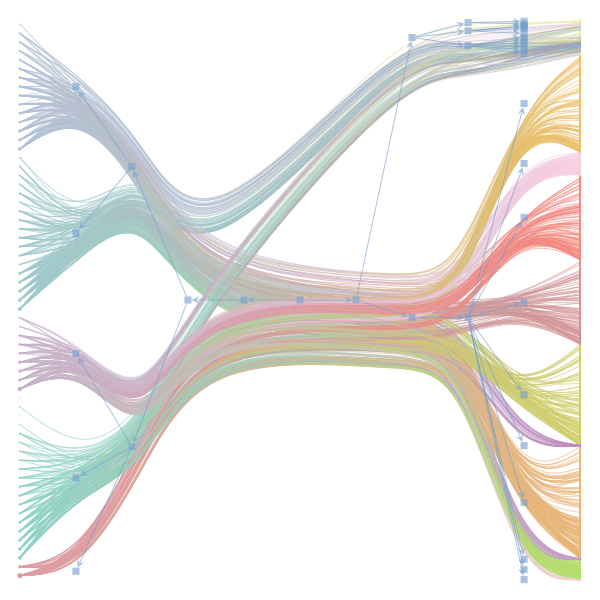
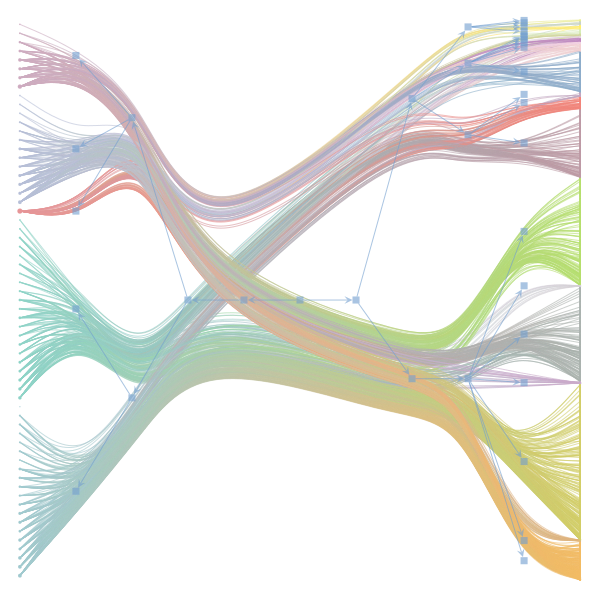
I agree that there's no clear correspondence to whether weighting or duplication is used, but chaotic blocks often have lower MDL. |
|
Perhaps it is the ordering of the vertices that is making the low MDL graphs look messy. If I'm not mistaken, |
|
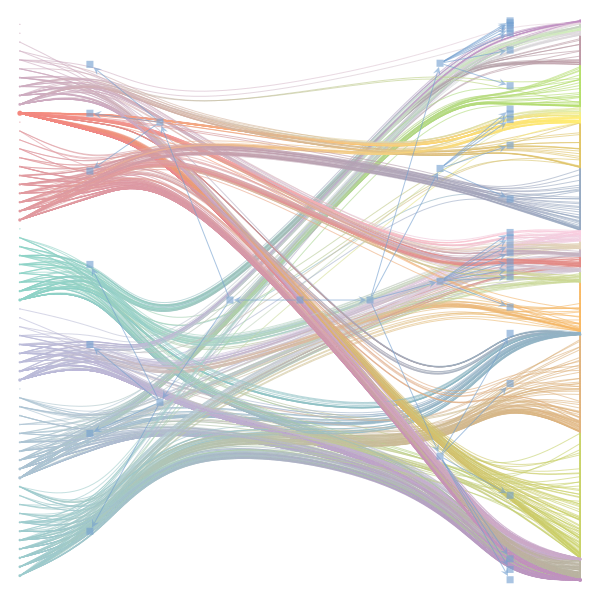
In general, a smaller MDL indicates a better model (in terms of compression). The result with the smallest MDL seems to be very compatible with the results we report in the paper (2 main groups for the documents and 3 main groups for the words). I did also observe that there seems to be several local minima of the MDL in which the solution corresponds to "chaotic block". The reason for this is not completely clear to me at the moment. Instead of the qualitative picture from the figure, one could compare the overlap in the assignment of nodes to blocks (group membership) using some metric such as the normalized mutual information to decide how similar the solutions are. I havent done that but will be interesting to see. Even then, the problem about the ground truth remains. While we have information about the categories of the articles as metadata - this doesnt mean it is a ground truth in terms of clustering of words in documents. For a real ground-truth test, we would need to run the algorithm on synthetic data in which we know the ground truth structure similar to benchmark graphs in community detection of networks. I havent done that yet, but think this could be very insightful when the algorithm works, and how good (also in comparison to other topic models). I also want to point out that the data in this example case is very small - some 60 wikipedia articles. Increasing the amount of data should make it easier to distinguish between genuine structure and spurious structure. |
|
Regarding the drawing of the networks: Do you think the 'chaotic blocks' are an artifact of the ordering of the nodes? |
|
I don't know, it's just a possibility.
|
The Jupyter notebook uses

make_graphwith the implicitcounts=True. The published plot looks something like this:but with

counts=TrueI can only get plots likeIs counts=True working for inference but not for plotting? Or is it broken for inference too?
The text was updated successfully, but these errors were encountered: