incorrect representation of mixed rgb and rgba colors in mesh3d #2306
Comments
|
Mesh3d has the property, |
|
@empet at the moment @z--m-n "flatshading": true,
"lighting": {
"vertexnormalsepsilon": 0,
"facenormalsepsilon": 0
},which is applied in this demo: https://rreusser.github.io/plotly-mock-viewer/#gl3d_bunny_cell-area |
|
One more note related to exporting trasparent 3-D plots. |
Okay, I will play with that. Please note that the output of the MWE does not change when using Replacing the definitions: ...
vxc0 = reindex_voxels([{**{i:j for i,j in v.items() if i in ['x','y','z','i','j','k']},
**{'facecolor': [k]*len(v['i'])}} for k,v in zip(cid,vxl) if k.startswith('rgba(')])
vxc1 = reindex_voxels([{**{i:j for i,j in v.items() if i in ['x','y','z','i','j','k']},
**{'facecolor': [k]*len(v['i'])}} for k,v in zip(cid,vxl) if k.startswith('rgb(')])
.... My use case for low opacity values is to mask out-of-range (e.g., NaN) values without having to update the coordinates ( |
I am not sure... Changing the Adding to the MWE: ...
# concatenate shapes and replace 'intensity' (vertex-mode) with 'intensity' (cell-mode)
vxd = reindex_voxels([{**{i:j for i,j in v.items() if i in ['x','y','z','i','j','k']},
**{'intensity': [v['intensity'][0]]*len(v['i'])}} for k,v in zip(cid,vxl)])
go.Figure(data=[go.Mesh3d(**vxd,colorscale=cs,intensitymode='cell')]). |
|
@empet @archmoj Thanks for the info, links and tweaks. Very helpful! I'll follow the developments over in plotly.js. Regarding the discontinuous breaks. Would a right (or left) side closed lookup at discontinuous In the example below: the middle square would become either black or light blue, not a mix of black and blue.
import numpy as np
import plotly.graph_objects as go

# custom colorscale, discontinuous break at 0.5
cs = [[0.0, 'rgb(64, 64, 64)'],
    [0.50, 'rgb(64, 64, 64)'],
    [0.50, 'rgb(127, 255, 255)'],
    [1.00, 'rgb(127, 255, 255)']]

# some shapes with color intensity 0.0, 0.5 and 1.0
vxl = [{'x': [-0.25, -0.25, 0.25, 0.25],
  'y': [-0.25, 0.25, 0.25, -0.25],
  'z': [-0.25, -0.25, -0.25, -0.25],
  'i': [0, 0],
  'j': [1, 2],
  'k': [2, 3],
  'intensity': [0.0, 0.0, 0.0, 0.0]},
 {'x': [0.25, 0.25, 0.75, 0.75],
  'y': [-0.25, 0.25, 0.25, -0.25],
  'z': [-0.25, -0.25, -0.25, -0.25],
  'i': [0, 0],
  'j': [1, 2],
  'k': [2, 3],
  'intensity': [0.5, 0.5, 0.5, 0.5]},
 {'x': [0.75, 0.75, 1.25, 1.25],
  'y': [-0.25, 0.25, 0.25, -0.25],
  'z': [-0.25, -0.25, -0.25, -0.25],
  'i': [0, 0],
  'j': [1, 2],
  'k': [2, 3],
  'intensity': [1.0, 1.0, 1.0, 1.0]}]

go.Figure(data=[go.Mesh3d(**v,cmin=0,cmax=1,colorscale=cs) for v in vxl]) |

|
The middle square is gray because plotly.js interpolates colors for Mesh3d. It works only with continuous colorscales, since it provides the property |
|
Please have a look at this demo. |
This is still an issue when your intensity value near the boundary of two colors. Code: running python 3.8.12 and plotly 5.9.0 Output: |

|
when you want to map an interval of real values, [a,b], onto a discrete colorscale, Your interval [a, b]=[0.2, 0.7], and the normalising function is f(t)=(t-0.2)/0.5. Hence your discrete colorscale should be:
|

|
thank you for the reply, however, this is not really addressing the bug I was calling out. A few notes:
For example:
Example of heatmap with same setup: example of mesh with setup:
you can see that I am using the same color scale, intensity values (z for heatmaps), cmin/cmax (zmin/zmax for heatmaps). Yet, the two plots handle boundaries quite differently. I do have a solution, I make the color faces from my color scale with my own interpolation function modeled off of your heatmap code. However, this should not be necessary, why do the different plots treat boundaries differently?? that is the bug I am calling out |


|
Just add cmin=0, cmax=1, to my code, and you'll notice that the middle triangle is green, i.e. it corresponds to the expectations, and isn't of interpolated color. Your colorscale is not defined following the algorithm of construction of a discrete colorscale, adapted to data i.e. to a sequence of values a=x₁< x₂< ... <xₙ=b, as I did here, and in a few examples on plotly community forum (I answered your question, there too). If you define your discrete colorscale according to this rule, you'll get the right color. |
|
Yes adding it to your code would make it green as .602 is well above .5. However, this will break down as you move that value closer. When you have thousands of points, continuously spread out, some will have to be near the line. That is what the simplified example is trying to show. I did not post the more comprehensive version as I thought the simpler example showed off the bug with as little extra fluff as possible. The key thing here is that the middle triangle color in my example is a given a color that should never exist in the range. .5 is not normalizing to exactly my break point, it is below that breakpoint, but somehow the red still bleeds in. That is what I am showing. In fact there seems to be a range at which the color will bleed in. to try and make this as clear as possible, here are some screen shots where I adjust the break point. In each one, the data stays the same, the cmin/cmax do not change etc. The only thing I change is where that break point is. .502: .503:
.504:
It should be binary. I am above the breakpoint, or below (I would understand if there was an edge case where points on the line get a hue, but that is not whats happening here). Instead of being binary, how close you are to the line seems to have an effect. Again, this does not happen with other plot types, just meshes |


|
Thanks @connorhazen - you're right, there is some point at which we start to do interpolation for import plotly.graph_objects as go
x = [1, 2, 3] * 101
y = [1 + (i//3) * 0.02 for i in range(303)]
z = [1, 3, 2] * 101
i = [i * 3 for i in range(101)]
j = [i * 3 + 1 for i in range(101)]
k = [i * 3 + 2 for i in range(101)]
intensity = [0.490 + (i * 0.0002) for i in range(101)]
scale = [
[0, "rgba(0, 128, 0,1)"],
[0.501, "rgba(0, 128, 0,1)"],
[0.501, "rgba(255, 0, 0,1)"],
[1, "rgba(255, 0, 0,1)"],
]
cmin = 0
cmax = 1
t = go.Mesh3d(
x=x,
y=y,
z=z,
i=i,
j=j,
k=k,
intensity=intensity,
intensitymode="cell",
colorscale=scale,
cmin=cmin,
cmax=cmax,
lighting={"vertexnormalsepsilon": 0, "facenormalsepsilon": 0},
facecolor=["red", "green", "blue"],
)
t2 = go.Scatter3d(
x=[1]*101,
y=[1 + (i * 0.02) for i in range(101)],
z=[3] * 101,
marker=dict(color=intensity, cmin=cmin, cmax=cmax, colorscale=scale)
)
fig = go.Figure()
fig.add_trace(t)
fig.add_trace(t2)
fig.show()Where we can see |

|
Thanks for the reply, and the much better visual to explain it :). I wanted to point this out because it took quite a bit of testing to figure out this actually existed and was my problem, in case others also experience this. I do have a solution on my end. I just do the color mapping my self and set as face color: Below is the function (sorry its in react) I created to call to map values. It could possibly be improved with binary search to speed it up, but my scale is somewhat simple most of the time, so did not implement yet Esentially, just move your point through the scale until you find what "insertion" point it has. then do you interpolation to find what color it should be assigned. ** interpolateRGB comes from d3-interpolate (copied that from the plotly repo) Maybe this is helpful for others. |
|
This is an example to illustrate that with a discrete colorscale, defined according to data, Any colorscale not defined by this algorithm works as a continuous colorscale, |

|
hmm ok..... Few notes: your colorscale is still a continuous colorscale at its root. You are not addressing the actual problem raised. I would recommend re-reading the messages above. Your 'solution' does not scale, due to the boundary condition |
|
I answered based on your initial example. Meanwhile I worked on the above code and did not read to see how the discussion evolved. I'll think about your new case. |
|
Ran your code with these intensities: [0, 0.499, 0.501, 1], as you can see, it does not work. I would also like to make it very clear that my goal is not to create a discrete scale. I am using this example to showcase a bug.
I hope that makes the problem more clear, although I would suggest alexcjohnson post above for the clearest visual |

Hi folks!
I encountered some unexpected behavior in
Mesh3d. I hope you could have a look. It is hard for me to judge if these are issues, here or upstream, or I am missing something.Incorrect colors in plots with
intensityand a discontinuouscolorscale(see panel f2).a) Colors with opacity (rgba) are shown without opacity (rgb). This issue was reported before.
b) Discontinuous transitions in the
colorscaleappear to be ignored. As a result, colors are introduced that are not found in the colorscale. In the example, panel f2: purple = black + magenta, raspberry = magenta + orange.c) I would expect the same colorscale behavior as in 'scatter' or 'heatmap' (panel f1).
Render artifacts occur for
facecolororvertexcolorsurfaces, when rgb and rgba colors are put in the same trace (see panel f3).a) Surfaces do look opaque when only rgb colors are present (panel f5).
b) A partial workaround was to plot rgb and rgba vertices in separate traces (panel f6). Not sure what to do when vertices have a gradient between rgb and rgba...
An additional trace is needed to add a colorbar when
facecolororvertexcoloris used instead ofintensity.a) I do expect the colorbar to be dropped when colors are hardcoded. But the workaround to add a custom
colorbarorcoloraxiswith a 'hidden' trace may not be obvious to everyone. Add an example to the documentation?The rgba colors in the
colorbarappear mixed with layoutpaper_bgcolor, effectively the transparent magenta colors are too dark in the Working Example.a) Can a
colorbarbackground be set to match the (default) plot background color?The image above is a screenshot and differs from the exported image, using
f7.write_image(...)after the Working Example below.a) In my exported copy, some of the layout
sceneaxes appeared 'ghost'-duplicated into the next subplot. Only visible if the scene axes (ranges) change between subplots. Issue on my system or in Orca?Screenshot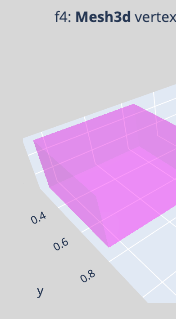 vs Orca[1.3.0]
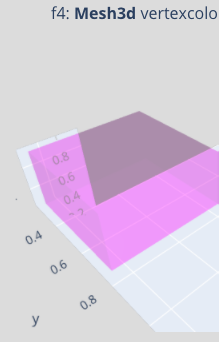
Finally, for a large number of shapes (or animations) I noticed significant performance loss in looking up and hardcoding the colors of vertices. Ideally, I would get the
intensitymethod ofMesh3dto give me the expected result (more like f6, less like f2). Any ideas? Your advise is appreciated!Sorry, not a very short MWE...
The text was updated successfully, but these errors were encountered: