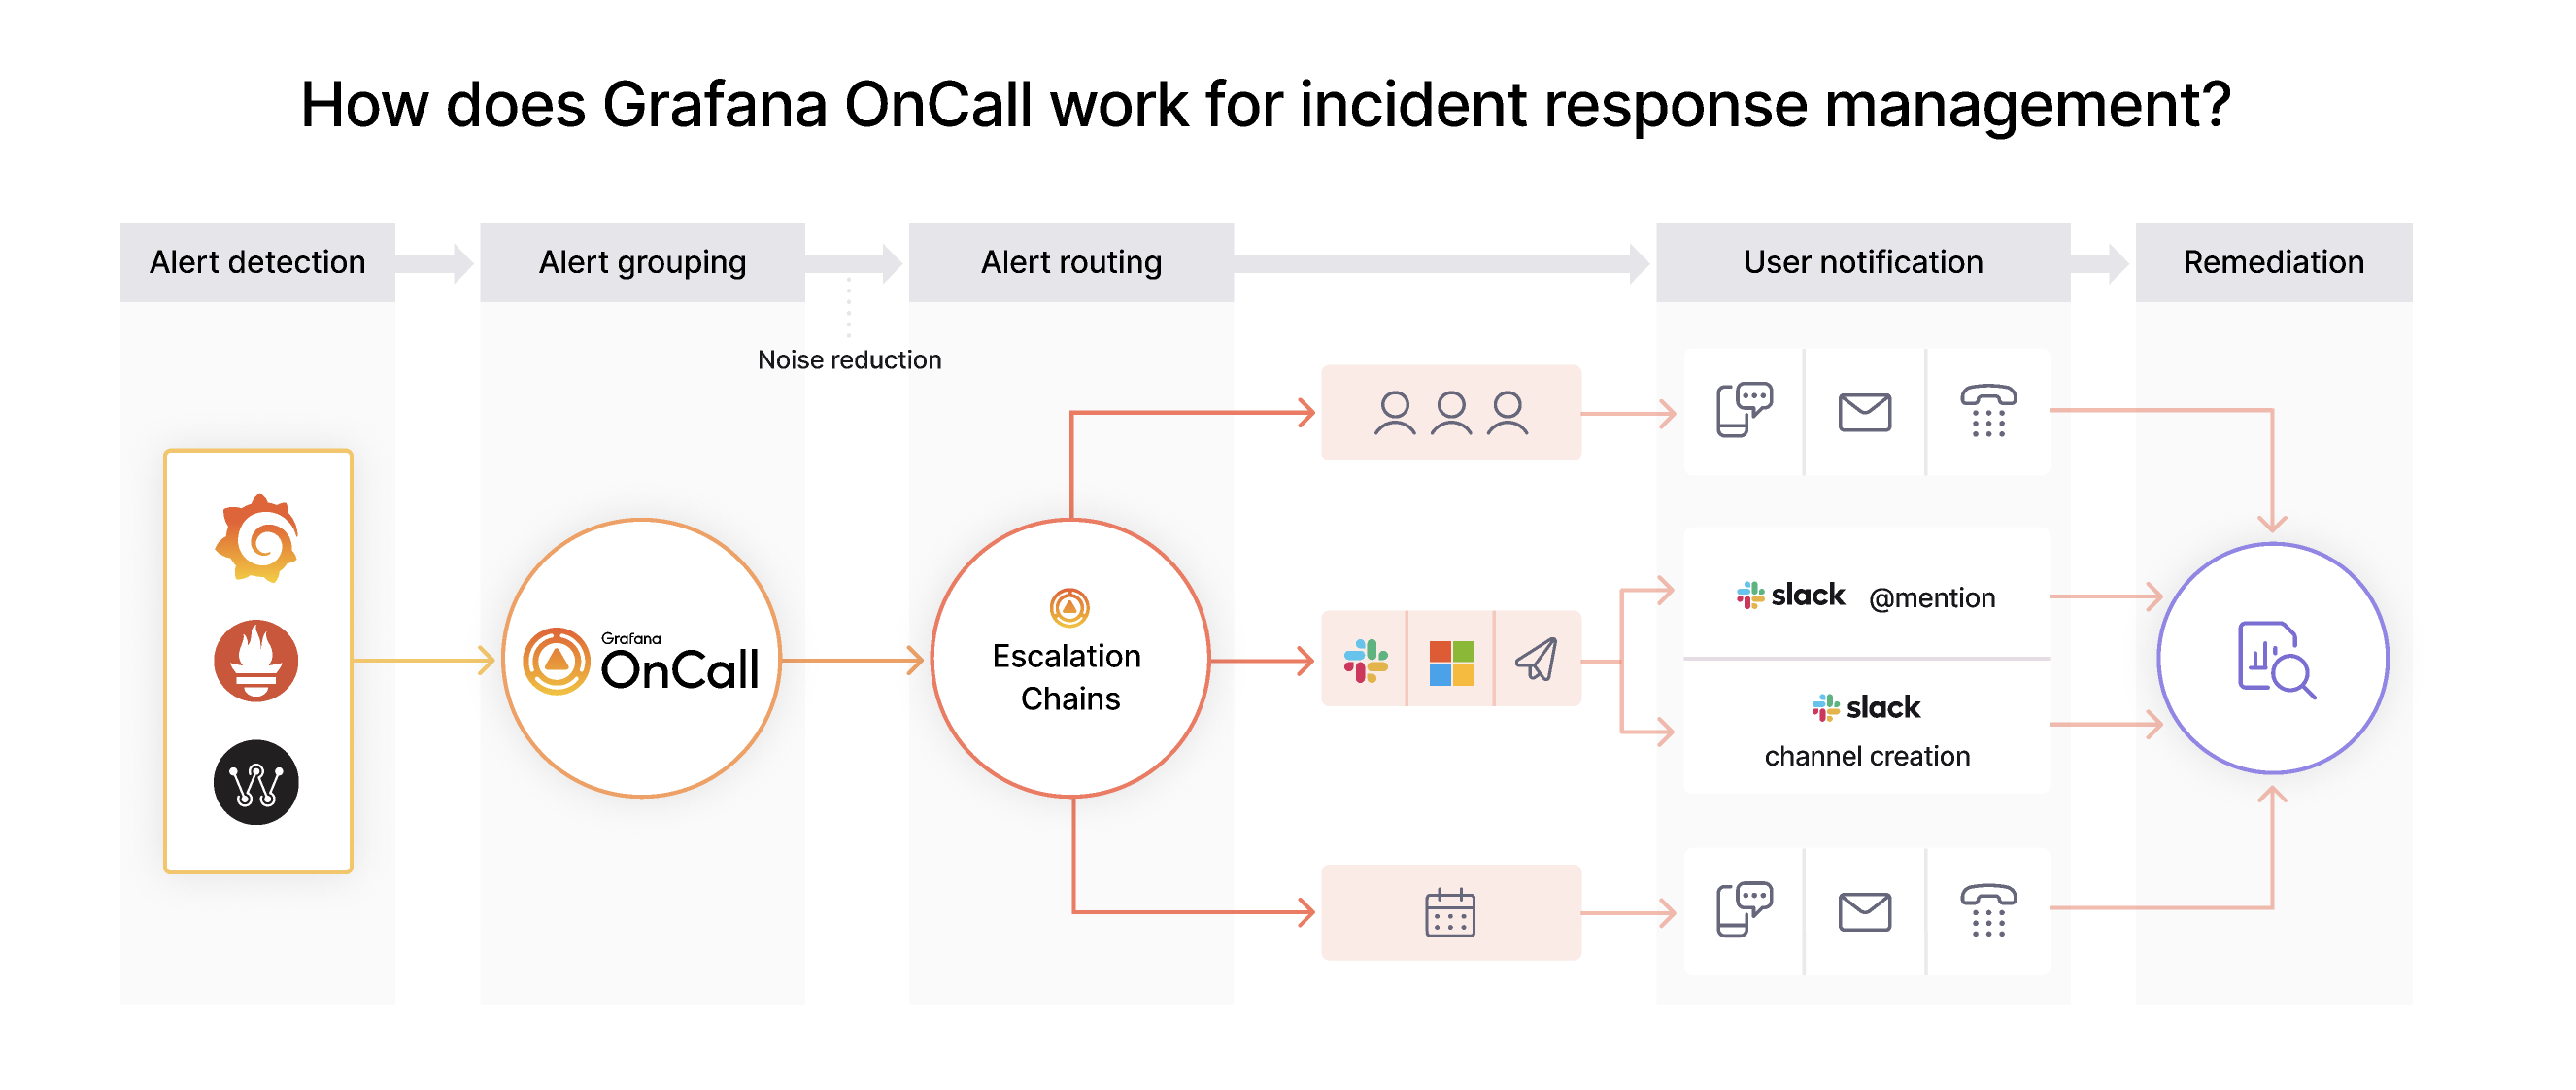
Developer-friendly incident response with brilliant Slack integration.
- Collect and analyze alerts from multiple monitoring systems
- On-call rotations based on schedules
- Automatic escalations
- Phone calls, SMS, Slack, Telegram notifications
compose.yaml:
include:
- path: https://github.com/qclaogui/codelab-monitoring.git#main:docker-compose/monolithic-mode/logs/compose.yaml

x-environment: &oncall-environment
  SEND_ANONYMOUS_USAGE_STATS: ${SEND_ANONYMOUS_USAGE_STATS:-false}
  DATABASE_TYPE: sqlite3
  BROKER_TYPE: redis
  BASE_URL: http://engine:8080
  SECRET_KEY: ${SECRET_KEY:-r4KriYc9sL6PJLaGdDRQL3PKqT6bufTx2uhj}
  FEATURE_PROMETHEUS_EXPORTER_ENABLED: ${FEATURE_PROMETHEUS_EXPORTER_ENABLED:-true}
  REDIS_URI: redis://redis:6379/0
  DJANGO_SETTINGS_MODULE: settings.hobby
  CELERY_WORKER_QUEUE: "default,critical,long,slack,telegram,webhook,retry,celery,grafana"
  CELERY_WORKER_CONCURRENCY: "1"
  CELERY_WORKER_MAX_TASKS_PER_CHILD: "100"
  CELERY_WORKER_SHUTDOWN_INTERVAL: "65m"
  CELERY_WORKER_BEAT_ENABLED: "True"
  GRAFANA_API_URL: http://grafana:3000
  EMAIL_HOST: inbucket
  EMAIL_PORT: 2500
  EMAIL_FROM_ADDRESS: [email protected]
  EMAIL_USE_TLS: false

services:
  engine:
    labels:
      metrics.grafana.com/scrape: true
      metrics.grafana.com/path: "/metrics/"
    depends_on:
      oncall_db_migration:
        condition: service_completed_successfully
      redis:
        condition: service_healthy
    image: &oncallImage grafana/oncall
    restart: always
    ports:
      - "8080"
    command: sh -c "uwsgi --ini uwsgi.ini"
    environment:
      <<: *oncall-environment
    volumes:
      - oncall_data:/var/lib/oncall

  celery:
    labels:
      metrics.grafana.com/scrape: false
    depends_on:
      oncall_db_migration:
        condition: service_completed_successfully
      redis:
        condition: service_healthy
    image: *oncallImage
    restart: always
    command: sh -c "./celery_with_exporter.sh"
    environment:
      <<: *oncall-environment
    volumes:
      - oncall_data:/var/lib/oncall

  oncall_db_migration:
    labels:
      metrics.grafana.com/scrape: false
    depends_on:
      redis:
        condition: service_healthy
    image: *oncallImage
    command: python manage.py migrate --noinput
    environment:
      <<: *oncall-environment
    volumes:
      - oncall_data:/var/lib/oncall

  redis:
    labels:
      metrics.grafana.com/scrape: false
    image: redis:7.0.5
    restart: always
    volumes:
      - redis_data:/data
    healthcheck:
      test: ["CMD", "redis-cli", "ping"]
      timeout: 5s
      interval: 5s
      retries: 10

volumes:
  oncall_data:
redis_data:compose.override.yaml:
services:
  # override included service grafana environment
  grafana:
    volumes:
      - ./config/grafana/provisioning/plugins/grafana-oncall-app.yaml:/etc/grafana/provisioning/plugins/grafana-oncall-app.yaml
      - ./config/grafana/provisioning/plugins/redis-app.yaml:/etc/grafana/provisioning/plugins/redis-app.yaml
      - ./config/grafana/provisioning/datasources/redis.yaml:/etc/grafana/provisioning/datasources/redis.yaml
    environment:
      GF_SECURITY_ADMIN_USER: oncall
      GF_SECURITY_ADMIN_PASSWORD: oncall
      GF_PLUGINS_ALLOW_LOADING_UNSIGNED_PLUGINS: grafana-oncall-app, redis-app
GF_INSTALL_PLUGINS: grafana-oncall-app, redis-appCOMPOSE_EXPERIMENTAL_GIT_REMOTE=true docker compose up -d --remove-orphansOnce all containers are up and running you can search for metrics in Grafana.
Important
😞 Grafana OnCall is available for authorized users only, please sign in to proceed. For this example login credentials: oncall/oncall.
Navigate to http://localhost:3000/a/grafana-oncall-app.
COMPOSE_EXPERIMENTAL_GIT_REMOTE=true docker compose down