Live Application Information
STS4 automatically detects JVM processes for running boot applications on your local machine.
When a running app is detected, STS 4 automatically shows hints by highlighting sections of source code with a light green background. Hovering over the highlights with the mouse pointer, data from the running app is displayed in a popup.
For some types of information, STS 4 may also show a 'quick summary' as a codelens. Codelenses are only supported in Eclipse and Vscode at the moment, not in atom. For Eclipse this has to be enabled via Preferences >> Language Servers >> Spring Language Servers >> Spring Boot Language Server.
If there are multiple instances of the app running on your machine, the live data from all those instances will show up in the hover information.
Live information is scraped from running apps using JMX to connect to Spring Boot Actuator Endpoints. This means that spring-boot-actuator must be added as a dependency to your application and endabled. The easiest way to accomplish this is to add the spring-boot-actuator-starter dependency to your application's pom.xml or build.gradle as explained here.
This section provides an overview of the different types of live information that are currently supported and how each of them can be accessed from the editor.
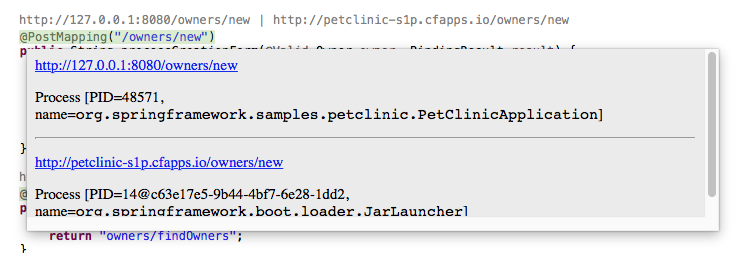
Live Request Mappings information is displayed for a running Spring Boot application. Live Request Mappings data is fetched from the application process. The data is mapped onto the Request Mappings definitions in the source code. A typical Request Mapping definition is the @ResquestMapping annotation. Such spots in the source code are highlighted with the light green background.
Hovering over such place in the source code displays Live Request Mapping information hover which shows the following:
- List of Live Request Mapping URLs defined by the Request Mapping defintions (hyper-links)
- Process information from which Live Request Mappings data has been fetched from
Code Lens is displayed on a dedicated line right above the green highlight in the source code. The Live Request Mapping URLs are displayed in a single line. Clicking on a URL opens this URL in the browser.
Both the hover and the Code Lens support multiple running Boot apps.
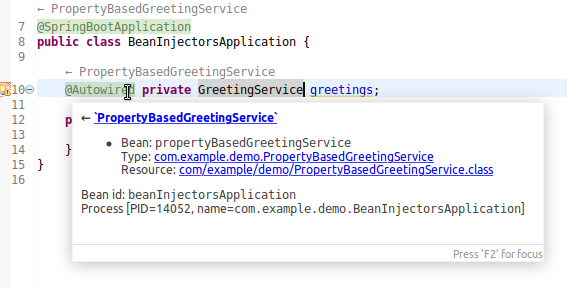
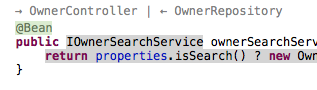
Live Beans information is displayed for a running Spring Boot application. Live Beans data is fetched from the application process. The data is mapped right onto the source code. Namely at the source code pieces where beans are injected or defined. Typically such places in the source code are Spring annotations but there are other places such as Component constructors, Spring Data repositories etc. These spots in the source code are highlighted with light green background.
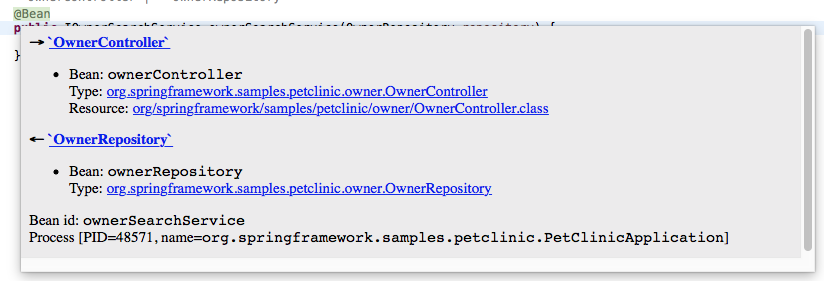
Live Beans hover is displayed when hovering over green highlights in the source code where beans are injected or defined. Typical Live Bean hover displays the following:
- List of beans current bean is injected into. Short summary list of beans in a single line followed by the detailed beans list
- List of beans wired into the current bean. Short summary list of beans in a single line followed by the detailed beans list
- Process information from which Live Beans data has been fetched from
Detailed list of beans provides for each bean the following:
- Bean ID
- Bean Java type (hyper-link)
- Resource defining the bean (hyper-link)
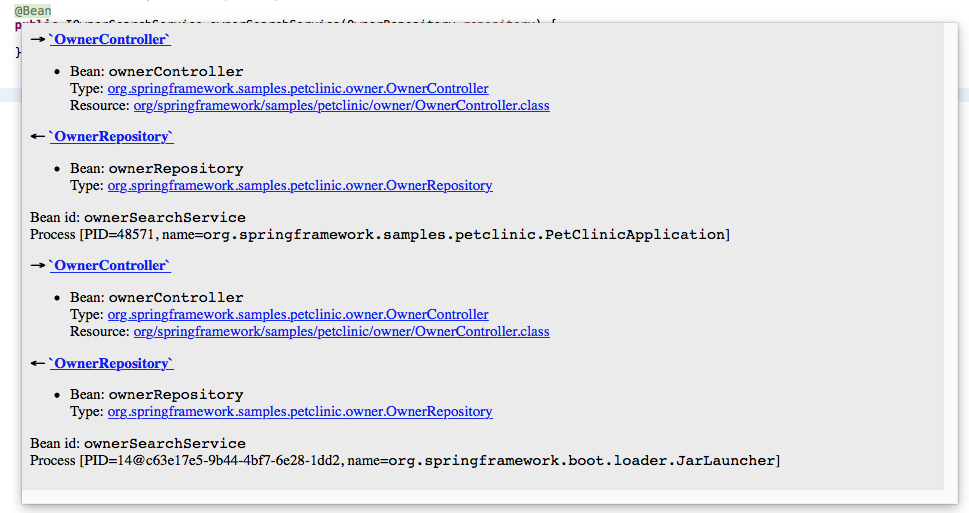
The hover can display Live Beans information for more than one running app as you can see below:
Code Lens is displayed on a dedicated line right above the green highlight in the source code. The Live Bean information displayed by the Code Lens is a short one line summary list of wired in beans and injected into beans for the current bean.
TODO fill this in
-
@ContidionalOn...: shows information about the conditions and their evaluation at runtime
Hovering over a @Profile will show wich profiles are currently active in running boot applications.
Additionally, the names of the profiles inside the annotation parameters will be highlighted, dependending on whether that specific profile is active.

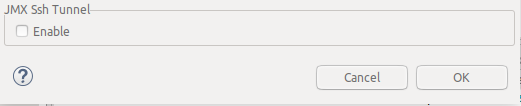
TLDR; If an app is deployed to cloudfoundry using the STS 4 Eclipse Spring Boot Dashboard, there is an option to enable JMX at the bottom of the deployment dialog:
Once the app is depployed. Live hovers will work automaticlly for that remotely deployed application.
Live information is scraped from actuator-enabled apps using JMX. For local apps a JMX connection can be established automatically and doesn't require any special actions to enable JMX.
However, for remote apps the tools cannot automatically discover the process nor enable JMX support on the remote JVM. So besides needing to have actuator enabled (this is the same as for local apps) there are some additional requirements for remote apps:
- JMX must be explicitly enabled on the remote JVM when it is launched. This is done by setting certain system properties.
- The remote host and port on which the remote JMX service is running must be made accessible from the local machine somehow.
- The Editor must be explicitly configured to know where to find the remote JMX service.
There are two ways to satisfy these additional requirements. An easy automatic way (this only works for apps deployed directly from the workspace to cloudfoundry); and a more involved, manual way.
When deploying an app to Cloudfoundry there is an option near the bottom of the Deployment Dialog where you can enable JMX.
This makes live hover information work for the remote application.
What happens under the hood:
- JMX is enabled on the deployed application by setting additional system properties via the
JAVA_OPTSenvironment variable. - When the app has fully started a local SSH tunnel is created, proxying the JMX service on a local port.
- The editor is configured with a JMX url pointing to that local port.
This makes live hover information work for the remote application.
You can also set this up manually. This may, for example, be necessary if you don't deploy your application directly from the workspace but use a CI/CD pipeline for deployment. Here we explain the process for an app deployed to Cloudfoundry, but in principle this process can also be adapted to any actuator-enabled spring-boot app, running anywhere.
Step 1: Enabling JMX.
This can be accomplished by adding system properties via the JAVA_OPTS environment variable. For example you could add this to your cf manifest.yml:
JAVA_OPTS: >
  -Dcom.sun.management.jmxremote.ssl=false
  -Dcom.sun.management.jmxremote.authenticate=false
  -Dcom.sun.management.jmxremote.port=33333
  -Dcom.sun.management.jmxremote.rmi.port=33333
  -Djava.rmi.server.hostname=localhost
  -Dcom.sun.management.jmxremote.local.only=false
Step 2: Creating an SSH tunnel
You can use the CF CLI to create a tunnel to the deployed app. For example:
$ cf ssh my-app-name -L 33333:localhost:33333
This will create an SSH session and open a bash prompt connected to the remote app. As long as this session is left open, JMX for that app can now be accessed on the local port (33333 in the example).
Note: Due to some JMX implementation details, you must use the same local and remote port numbers (both are 33333 in the example). If you attempt to change the local port without also changing the remote port to the same number, then it will not be possible to establish a JMX connection over the resulting SSH tunnel.
You can verify your tunnel is setup correctly by attempting to connect to the remote JVM with jconsole using this command jconsole localhost:33333.
**Step 3: Configure the Editor
The final step differs slighty depending on the Editor you are using (Eclipse / Vscode / Atom). But each of the editors are configured by pasting an identical json snippet into a specific setting. The snippet should look something like the following:
[
    {
        "jmxurl" : "service:jmx:rmi://localhost:33333/jndi/rmi://localhost:33333/jmxrmi",
        "host" : "my-app-host-for-http.cfapps.io"
    }
]
Note that the snippet is a json list, so you can configure more than one remote app at the same time.
For Eclipse, paste this snippet into Preferences >> Language Servers >> Spring Language Servers >> Spring Boot Language Server >> Remote Boot Apps.
For Vscode, enter it as the value for the configuration key boot-java.remote-apps (in either user or workspace settings).
For Atom, TODO alex?
A background thread is used to periodically scrape running processes for live information. This could negatively affect your machine's performance. This feature can be completely disabled:
- Eclipse/Spring Tool Suite 4: via the preferences
Spring -> Spring Boot Language Server - Code: regular JSON preference mechanism using the key:
boot-java.boot-hints.on. - Atom: regular preference mechanism