We will use Grafana Cloud to observe and monitor both the Signer and its corresponding Stacks node.
Grafana's application observability docs have a great quick-start. We will use:
- Grafana Cloud to collect metrics and visualize them.
- Grafana Alloy, on the Signer host, to push the metrics.
Before we begin, create a Grafana Cloud account (they offer a free tier that you can use).
Once done, access your dashboard and:
- Click on "Connections", then
- "Add new connection", and
- select "Hosted Prometheus metrics".
- Now select "Via Grafana Alloy", then
- on step 2, select "Run Grafana Alloy" to generate an API token.
Note the token GCLOUD_RW_API_KEY and the parameters GCLOUD_HOSTED_METRICS_URL
and GCLOUD_HOSTED_METRICS_ID, we will use them later.
Ensure both your Signer configuration and your node configuration include the following lines:
# signer-config.toml
# ...
# Adjust to 0.0.0.0:30001 if running in Docker.
metrics_endpoint = "127.0.0.1:30001"
# node-config.toml
[node]
# ...
# Adjust to 0.0.0.0:9153 if running in Docker.
prometheus_bind = "127.0.0.1:9153"If you compile the application binaries yourself, remember to enable the Cargo
feature monitoring_prom while building them, for example:
cargo build --features monitoring_prom,slog_json --releaseOnce both binaries are running with the updated configuration, you can peek at the metrics being exposed:
curl 127.0.0.1:30001/metrics
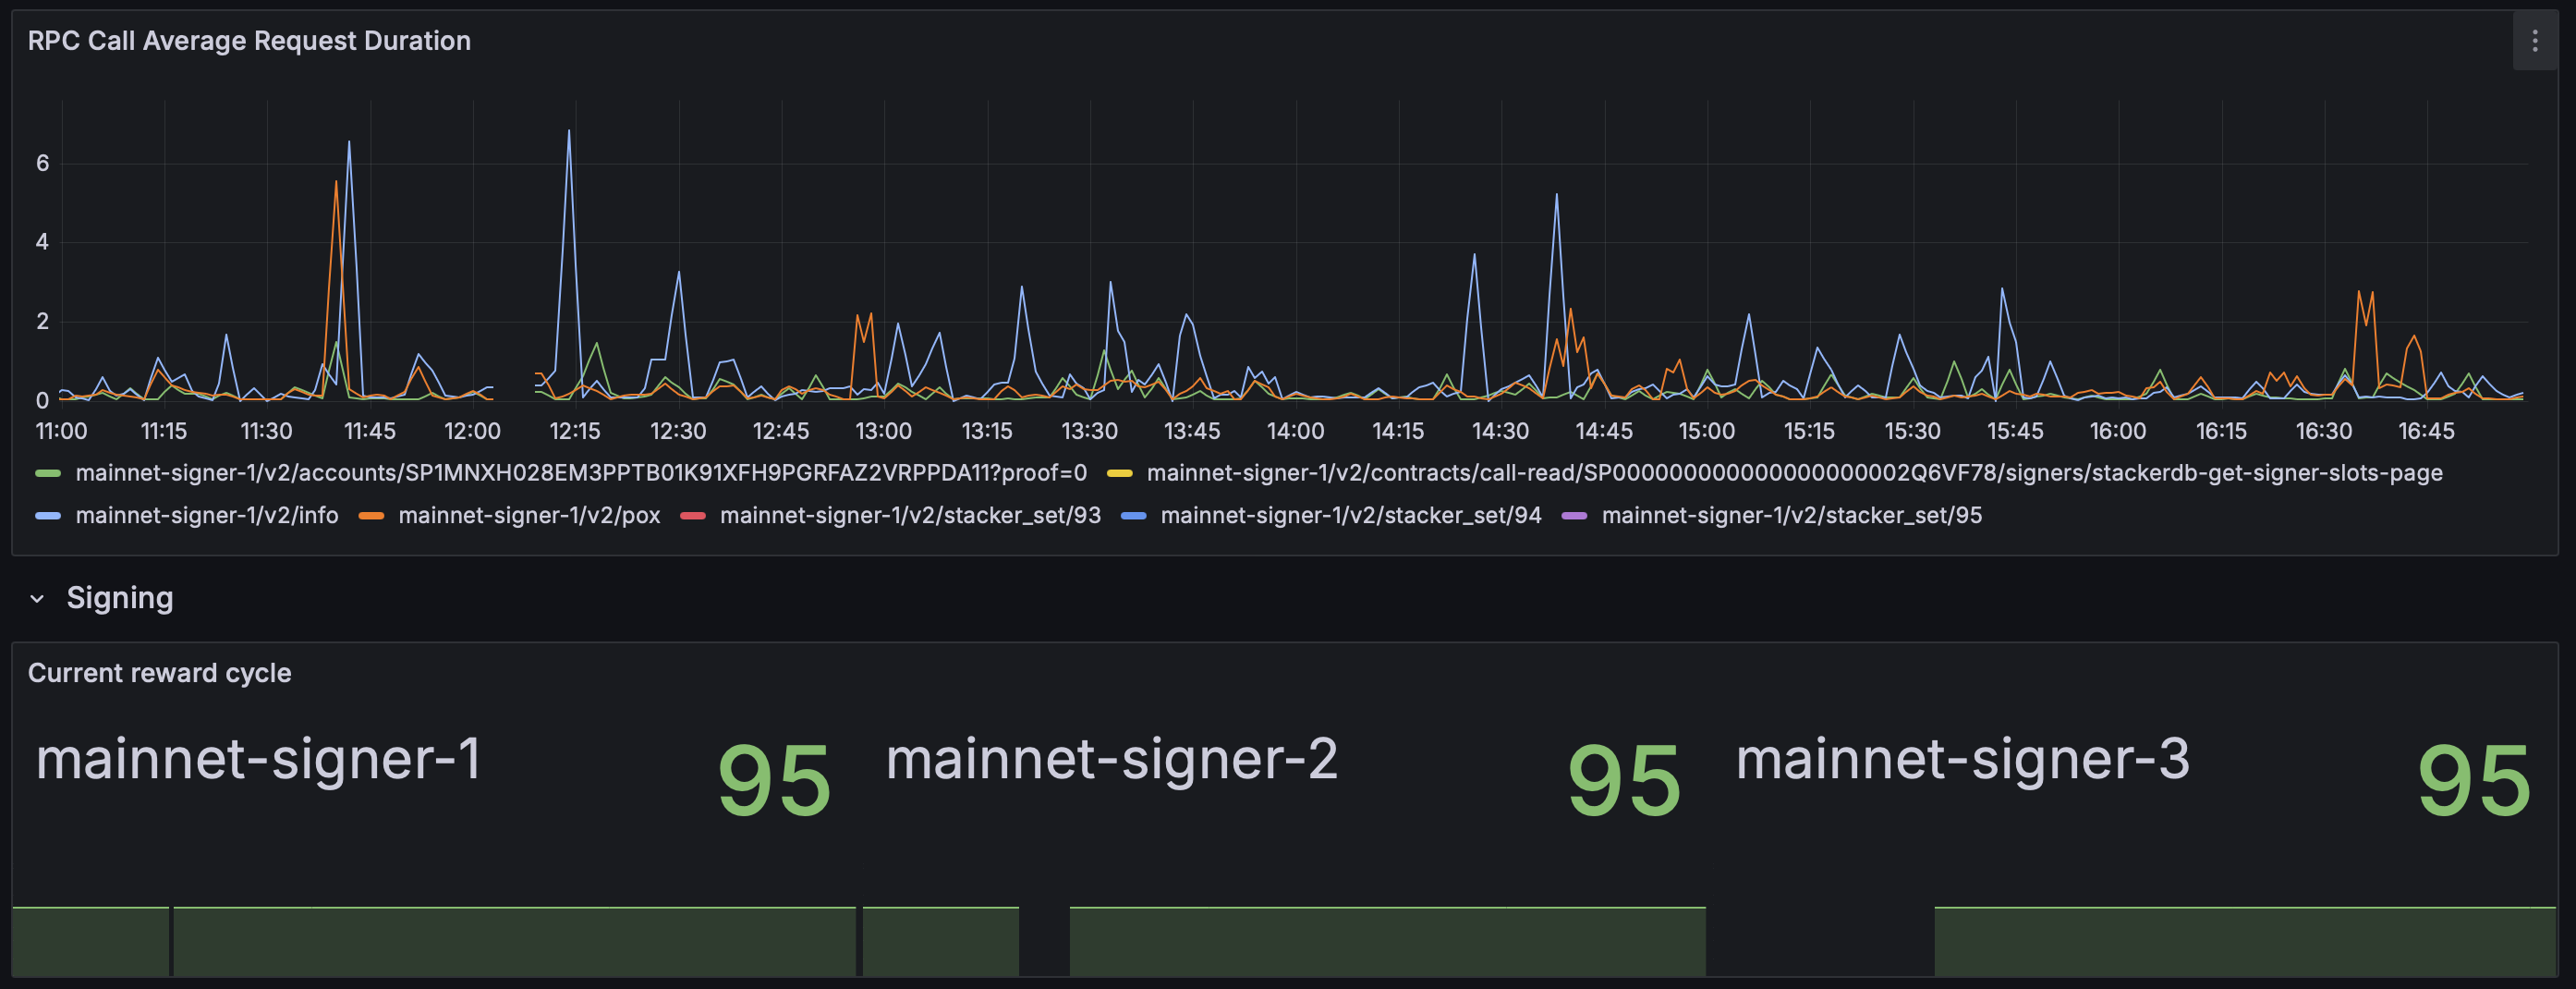
# HELP stacks_signer_current_reward_cycle The current reward cycle
# TYPE stacks_signer_current_reward_cycle gauge
stacks_signer_current_reward_cycle 95
# HELP stacks_signer_node_rpc_call_latencies_histogram Time (seconds) measuring round-trip RPC call latency to the Stacks node
# TYPE stacks_signer_node_rpc_call_latencies_histogram histogram
...
stacks_signer_node_rpc_call_latencies_histogram_bucket{path="/v2/info",le="0.005"} 0
stacks_signer_node_rpc_call_latencies_histogram_bucket{path="/v2/info",le="0.01"} 0
stacks_signer_node_rpc_call_latencies_histogram_bucket{path="/v2/info",le="0.025"} 0
stacks_signer_node_rpc_call_latencies_histogram_bucket{path="/v2/info",le="0.05"} 985
stacks_signer_node_rpc_call_latencies_histogram_bucket{path="/v2/info",le="0.1"} 1194
...Also, you'll have a /info endpoint on the same port:
curl 127.0.0.1:30001/infoFollow these instructions to install Grafana Alloy.
On Debian-based distributions:
sudo apt install gpg
sudo mkdir -p /etc/apt/keyrings/
wget -q -O - https://apt.grafana.com/gpg.key | gpg --dearmor | sudo tee /etc/apt/keyrings/grafana.gpg > /dev/null
echo "deb [signed-by=/etc/apt/keyrings/grafana.gpg] https://apt.grafana.com stable main" | sudo tee /etc/apt/sources.list.d/grafana.list
sudo apt-get update
sudo apt-get install alloyEdit the file /etc/alloy/config.alloy as follows, by taking care of replacing
the placeholders related to the prometheus endpoint with the parameters
obtained when creating a Grafana Cloud account before:
GCLOUD_HOSTED_METRICS_URLGCLOUD_HOSTED_METRICS_IDGCLOUD_RW_API_KEY
// For a full configuration reference, see https://grafana.com/docs/alloy
// For a default configuration, integrating all environmental variables from Grafana Cloud
// see https://storage.googleapis.com/cloud-onboarding/alloy/config/config.alloy

logging {
  level = "warn"
}

prometheus.exporter.unix "default" {
  include_exporter_metrics = true
  disable_collectors       = ["mdadm"]
}

prometheus.scrape "default" {
  targets = array.concat(
    prometheus.exporter.unix.default.targets,
    [
      {
        // Self-collect metrics
        job         = "alloy",
        __address__ = "127.0.0.1:12345",
      },
      {
        // stacks-signer
        job         = "stacks-signer",
        __address__ = "127.0.0.1:30001",
      },
      {
        // stacks-node
        job         = "stacks-node",
        __address__ = "127.0.0.1:9153",
      },
    ],
  )

  forward_to = [prometheus.remote_write.metrics_service.receiver]
}

prometheus.remote_write "metrics_service" {
  external_labels = {"instance" = constants.hostname}
  endpoint {
    # TODO: Edit the URL below with your Grafana production URL.
    # should end with /api/prom/push
    url = "<your GCLOUD_HOSTED_METRICS_URL>"

    # TODO: Edit with your Grafana Cloud ID and Token
    basic_auth {
      username = "<your GCLOUD_HOSTED_METRICS_ID>"
      password = "<your GCLOUD_RW_API_KEY>"
    }
  }
}
sudo systemctl daemon-reload
sudo systemctl enable alloy.service
sudo systemctl start alloy.service
Metrics from your Signer and node will now start being pushed to Grafana Cloud.
You can now start building a dashboard to visualize the metrics.
- Log-in to Grafana Cloud and create a new Dashboard.
- Pick the Prometheus instance you created before as the data source.
- Create a new panel and pick
stacks_signer_current_reward_cyclefrom the metrics.
You should now be able to see Stacks' current reward cycle, as measured by the Signer, into the dashboard.
Grafana comes with powerful data visualization tools. You can read about how to query and transform data here, while here you will find examples on how to build Prometheus queries.
This template will kick-start your dashboard.
Since we are here, we can also monitor the host itself. Debian-based
distributions make it very easy for us by using
node_exporter.
sudo apt install prometheus-node-exporter
sudo systemctl enable prometheus-node-exporter
sudo systemctl start prometheus-node-exporter
This will expose metrics on port 9100 of localhost.
We can now configure alloy to push them to Grafana. Edit your
/etc/alloy/config.alloy file and add the following:
prometheus.scrape "default" {
  targets = array.concat([

  ...

    {
        job         = "node_exporter",
        __address__ = "127.0.0.1:9100",
    }

  ...
])}
Now reload alloy and check its status:
sudo systemctl reload alloy
sudo systemctl status alloy
node_exporter provides a lot of metrics. Poke at them through the Grafana
Explorer or use one of the many prepared dashboard (e.g., this
one) to see
comprehensive information. Once you have a dashboard ready, you can also
use it to configure a few alerts (e.g., on disk space, etc).