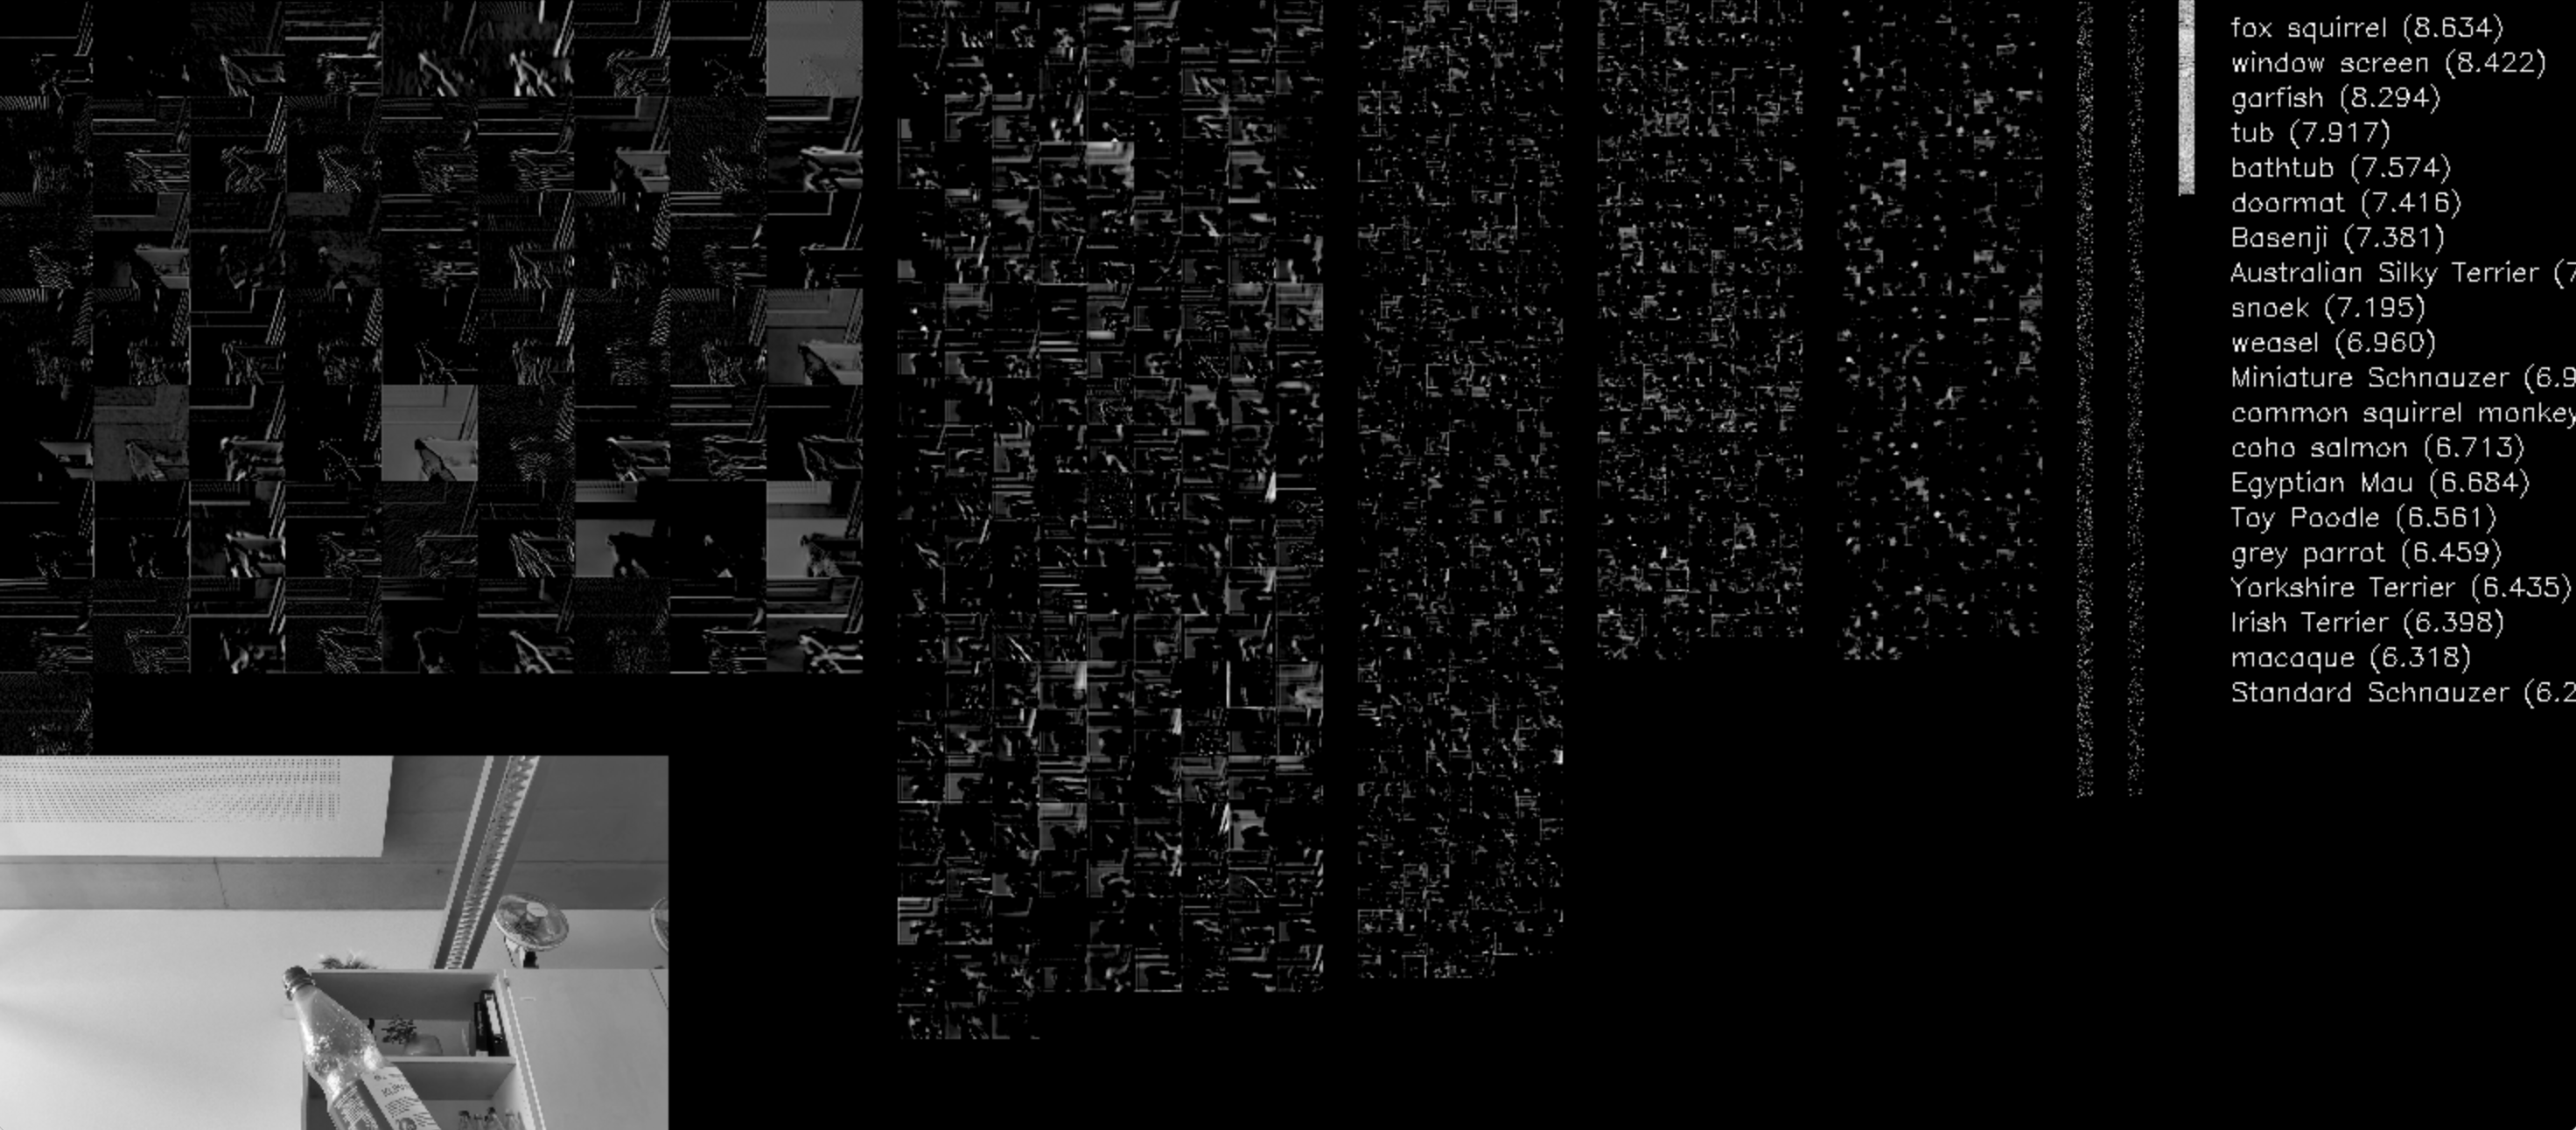
This is a simple example of how to visualize the activations of a convolutional neural network layer. The example uses the AlexNet network, displaying the feature maps of all convolutional layers, and the activations of the fully connected layers when the model is fed a live stream of your laptop camera! You can start the visualization by first installing the required packages in a virtual environment of your choice, and then running the script:
$ pip install -r requirements.txt
$ python real_time_cnnvis.py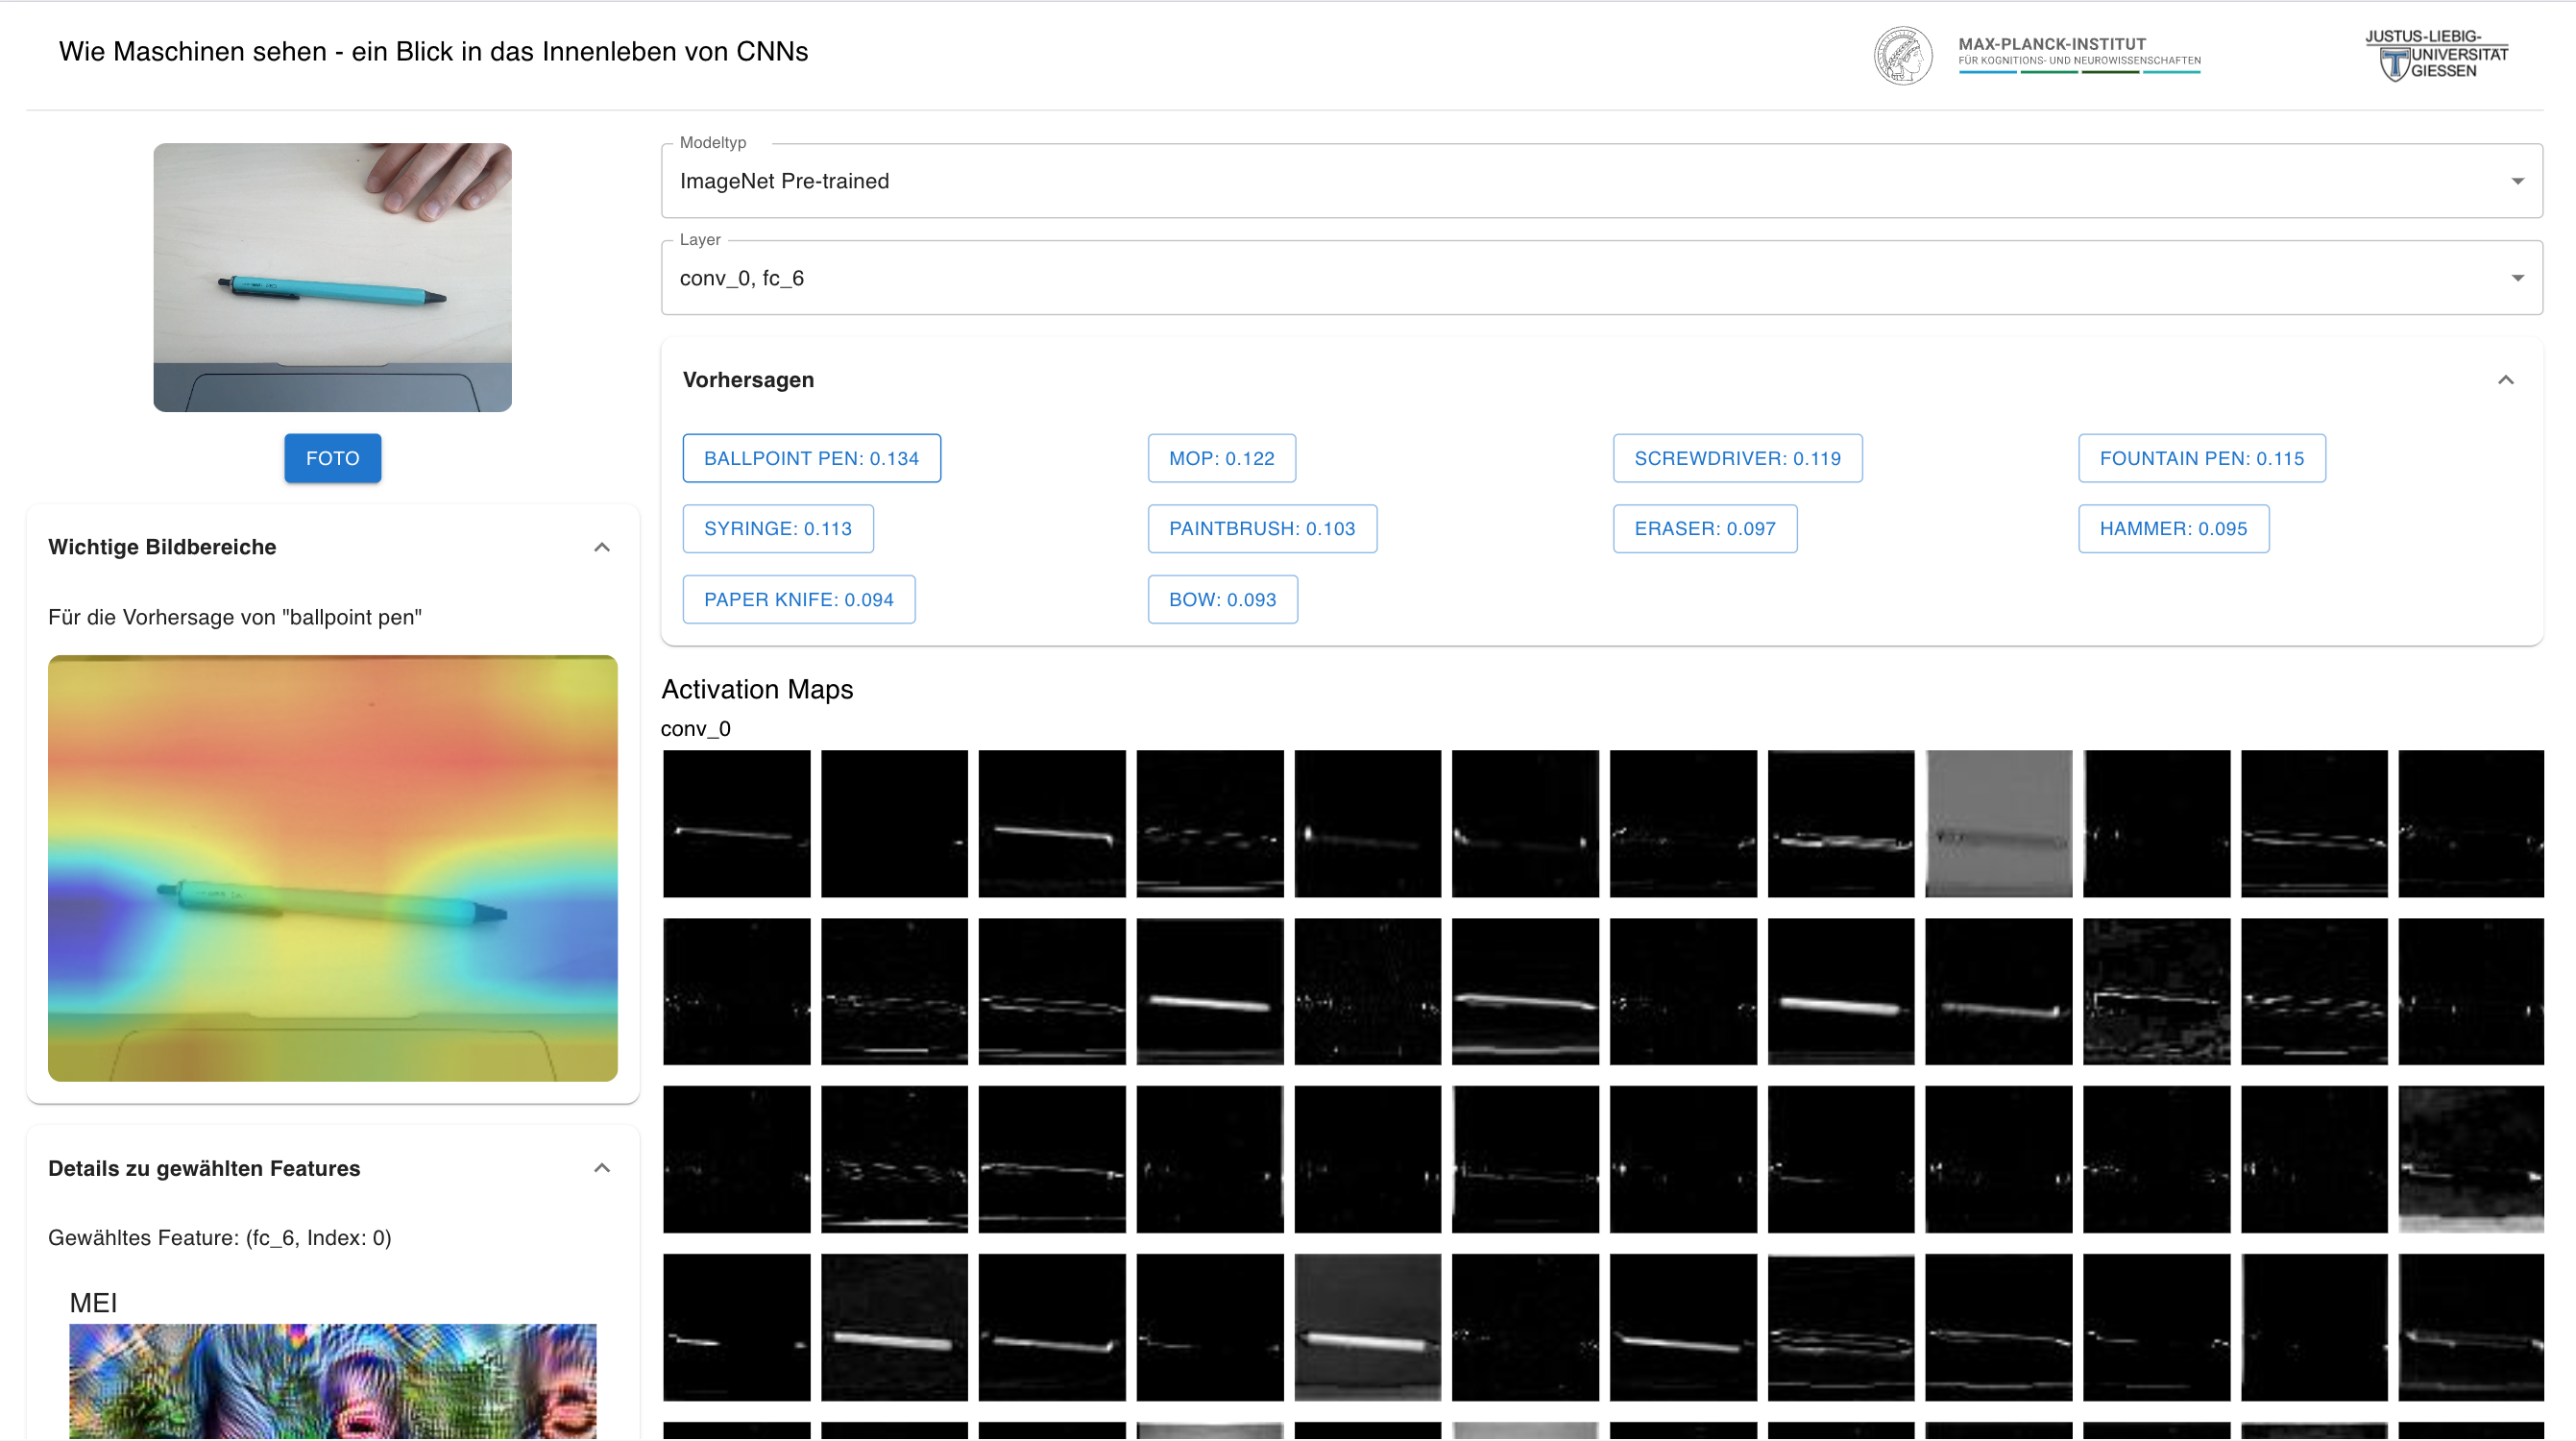
Additionally, I created a more interactive version of this visualization, which allows you to select the layer you want to visualize, and the image you want to feed to the network. This app uses a Flask (Python) backend to extract features on the fly and a React (Javascript) frontend to display the visualisation.
The interactive_cnnvis directory contains the code for this app, please refer to the README in that directory for instructions on how to set it up.