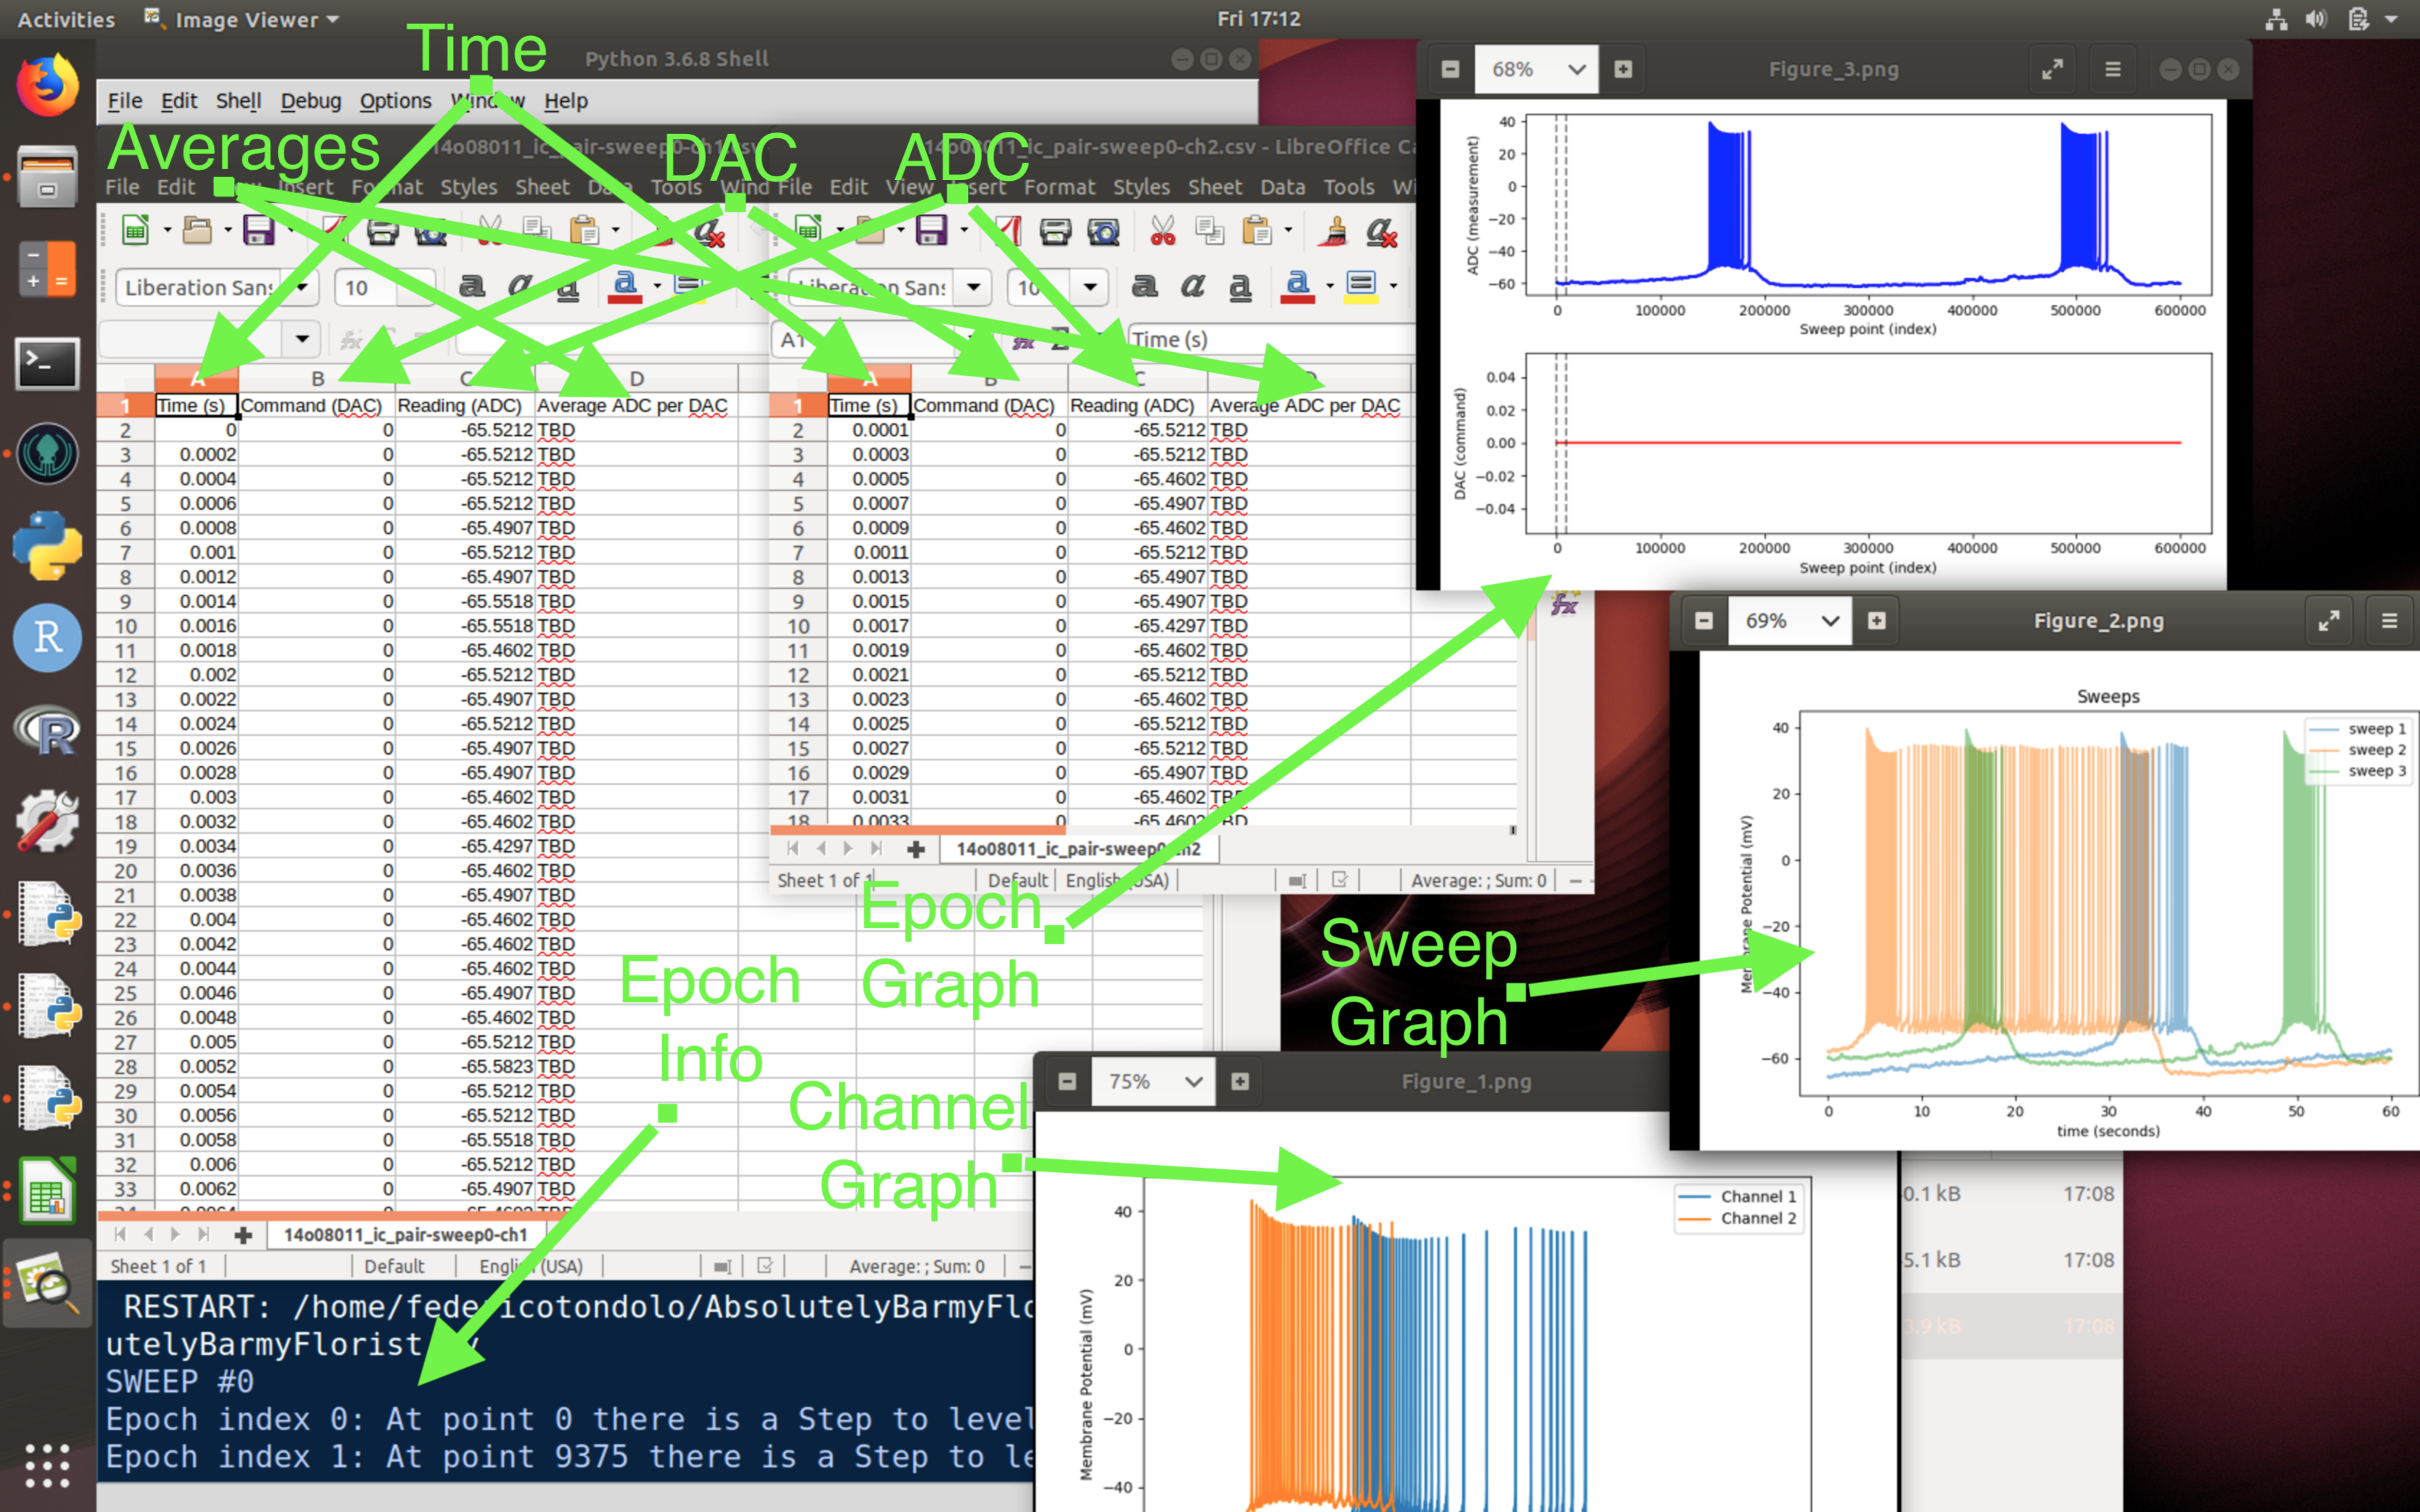
An attempt to include the entirety of the pyABF library and more, this is a program that reads all the ABF files in its directory and creates a series of CSV files for each of the ABF files' channels and sweeps with some minor data analysis mixed in. Code solidly based on pyABF sample code. It creates an OUTPUT folder in which files with the format <filename>-sweep<#>-ch<#>.csv are saved. In the console every single DAC change is displayed organized by sweep alongside info such as where it happens and what is its final value. The code also generates Epoch, Tag, and Sweep graphs for every single sweep in all channels contained within the input file, DROPS THE MIC...
AbsolutelyBarmyFlorist is, as you can probably guess, insane. It has a massive amount of features, however, this makes it unimaginably slow. SimplisticFlorist does away with all the visual fantasmagoria and console interactions thus keeping the runtime (relatively) in check. The CSV creation hierarchy is very much the same.
Due to the naming structure, it is necessary that there are no folders named 'OUTPUT' in the program's directory, and that every abf filename have no spaces in it. The CSV files generated by these two botanical entepreneurs have 4 columns The first is Time, the second is the DAC value, the third is the ADC reading, and the last is the Average of the ADC over the DAC. What does this mean? I scarcely know myself but here's what I inteded: the average ADC reading for a given DAC. The rows in this column are msotly filled with TBDs, however, the last cell before the DAC value changes contains the average ADC reading while the DAC was at that value. Also, please note that AbsolutelyBarmyFlorist shows a grap for every sweep in every channel, that can be a lot of graphs, if need be, change it!