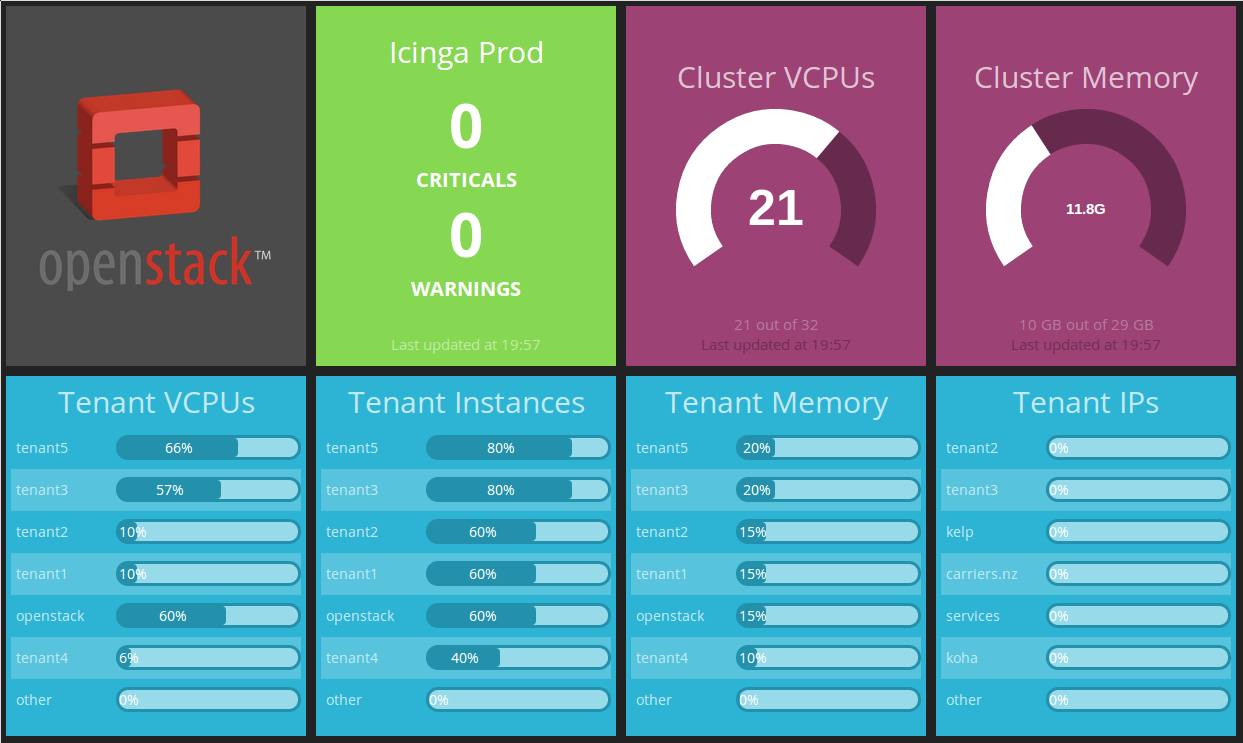
dashing based dashboard displaying status of an openstack cluster.
==============
This repo contains the widgets, the dashboard definition, and the required data collection jobs.
It provides one single dashboard with the following components:
- Nagios or Icinga monitoring status (critical, warning)
- Usage per tenant (vcpus, memory, instances, floating ips)
- Global cluster usage (vcpus, memory)
Aviator, an openstack API in ruby.
OpenStack credentials with appropriate privileges for tenant list and tenant usage queries.
Start by getting dashing.
You can find more details in the website, but something like this should work (ubuntu):
apt-get install rubygems ruby-bundler nodejs
gem install dashing
Dashing seems to go out of memory on devices like raspberrypi. A workaround
was implemented in the ceph dashboard, just add ?refresh=X to the url to
have it refreshed every X seconds.
CPU and Memory allocation ratios have to be defined in the config file (would be better to get them from an API call).
All contributions more than welcome, just send pull requests.
GPLv3 (check LICENSE).
Ricardo Rocha [email protected]
Please log tickets and issues at the github home.
Simple debian/ubuntu packaging is provided, check here for instructions.
